 Marina Lyubimova

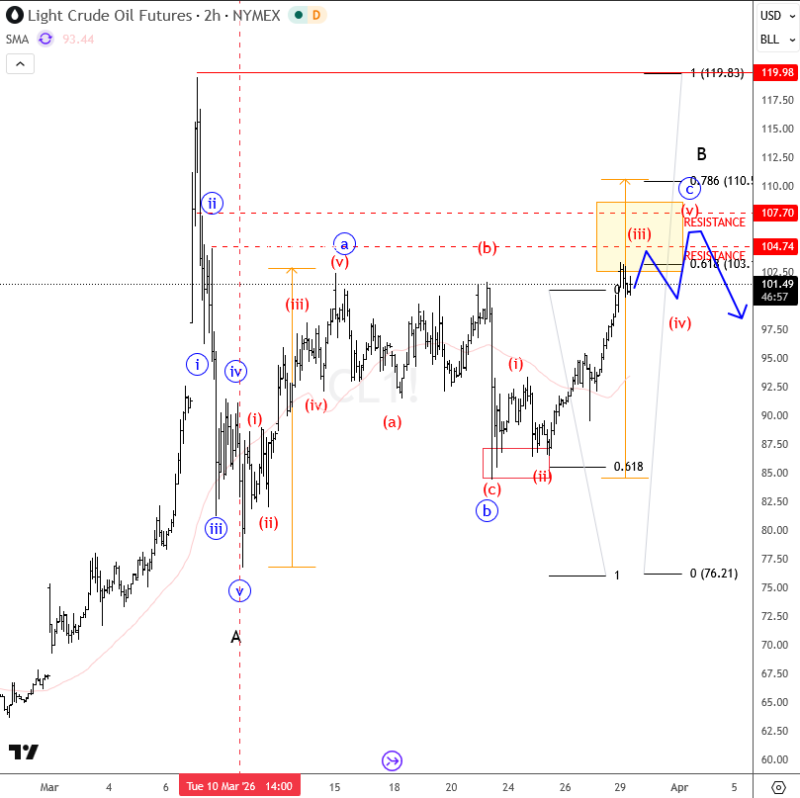
Crude oil prices have been climbing steadily, but the latest chart structure suggests the rally may be running out of room. The move fits cleanly into a C-wave pattern, and the market is now pressing into a resistance zone where price has historically struggled to push higher - a setup worth watching closely for a potential turn.
According to Grega Horvat, the market has moved as anticipated through the corrective recovery phase, and the structure now reflects a near-completed leg rather than the beginning of a fresh impulsive trend.
The $104-$107 resistance level crude oil is facing now
Price has climbed into a clearly defined reversal zone, with resistance clustering in the $104-$107 range and extending toward higher levels near $110. This is not an arbitrary area - it aligns with broader crude oil technical behavior, where strong rallies tend to stall near clustered resistance before the next directional move takes shape.
The market has come nicely higher into this phase, confirming the anticipated upward move.
The chart shows crude oil advancing after a prior corrective phase, forming a structured upward move that is consistent with a C-wave progression. What makes the current setup notable is how cleanly price has followed the expected path - the advance has been orderly, not impulsive, which tends to favor a reversal once resistance is reached.
Why the $110 zone could define the next trend in crude oil
If the $104-$107 area fails to cap the move, analysts are already pointing to the $110-$120 range as the next meaningful barrier. History shows that sharp breakouts above $109-$110 have triggered accelerated moves in both directions, which makes that zone a critical test for trend continuation.
Sharp breakouts above $109-$110 have historically triggered accelerated moves, confirming the importance of this zone in shaping trend direction.
What to watch as crude oil enters the late-stage rally phase
The chart structure suggests the rally is entering a late-stage phase. As price approaches resistance, the probability of either consolidation or reversal increases - especially after a strong directional move that did not see meaningful pullbacks along the way.
The projected path on the chart points to a potential pullback scenario following the completion of the current wave. This reflects a typical pattern where markets react after reaching clustered resistance zones, with sellers stepping in as buyers begin to fade.
Whether the market continues higher toward extended targets or begins a corrective move will depend on how price behaves within this zone.
For now, crude oil remains elevated - but the next reaction from resistance will likely set the tone for short-term direction. The C-wave structure is close to complete, and the signal traders are focused on now is how strongly the market defends - or breaks through - the levels that matter most.
 Marina Lyubimova


