 Alex Dudov

⬤ Silver is approaching a key technical inflection point as price compresses inside a large symmetrical triangle on the chart. The structure has formed over roughly 18 months following the metal's previous rally and subsequent consolidation. The tightening range indicates silver may soon reach the apex, where a decisive breakout could define the next major directional move. Currently trading near the $84 level, XAG/USD oscillates between descending resistance and rising support lines forming the triangle.
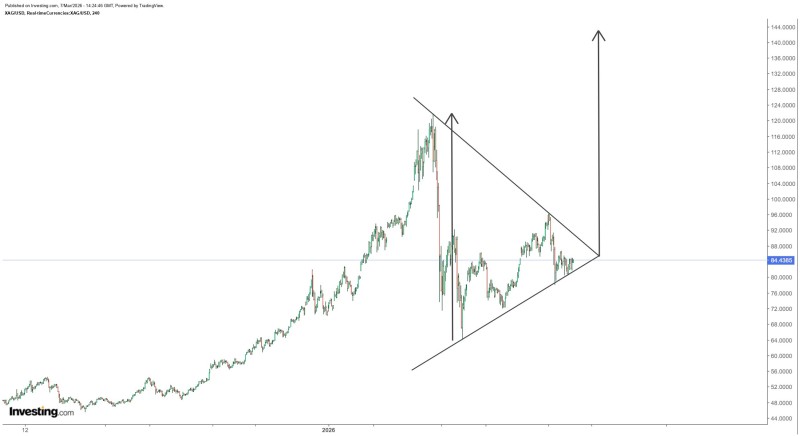
⬤ Triangle formations typically emerge after strong directional moves when the market enters a balance between buyers and sellers. As the trading range narrows, volatility tends to decrease before expanding sharply when price escapes the pattern. This kind of range compression often signals a major move is building beneath the surface, and silver's current structure fits that profile well.
⬤ The potential price objective is calculated using the amplitude of the triangle's base projected from the breakout point near the apex. Applying this classic measured-move method suggests a possible rally toward the $140 region if the pattern resolves to the upside. Triangle breakouts of this scale have historically preceded strong directional momentum once resistance is cleared.
⬤ Large multi-month consolidations reflect extended periods of accumulation or distribution. The compression in XAG/USD suggests silver has been stabilizing at elevated price levels after earlier volatility. As discussed in prior analysis, holding key support zones above $80 has preserved the broader bullish market structure, keeping higher targets in play.
⬤ Silver remains a key global commodity, sensitive to inflation expectations, currency dynamics, and industrial demand shifts. The tightening triangle structure suggests the market is approaching structural resolution. Whether the breakout comes upward or downward, the move out of this multi-month formation is likely to shape the next major phase of XAG/USD price action.
 Alex Dudov


