 Marina Lyubimova
Silver's recent price action tells a story of both strength and caution. After a powerful rally that sent the precious metal soaring past long-term averages, the market is now taking a breather. This pullback from technical extremes offers traders important clues about where the metal might head next.
Silver Tests Resistance at Upper Bollinger Band
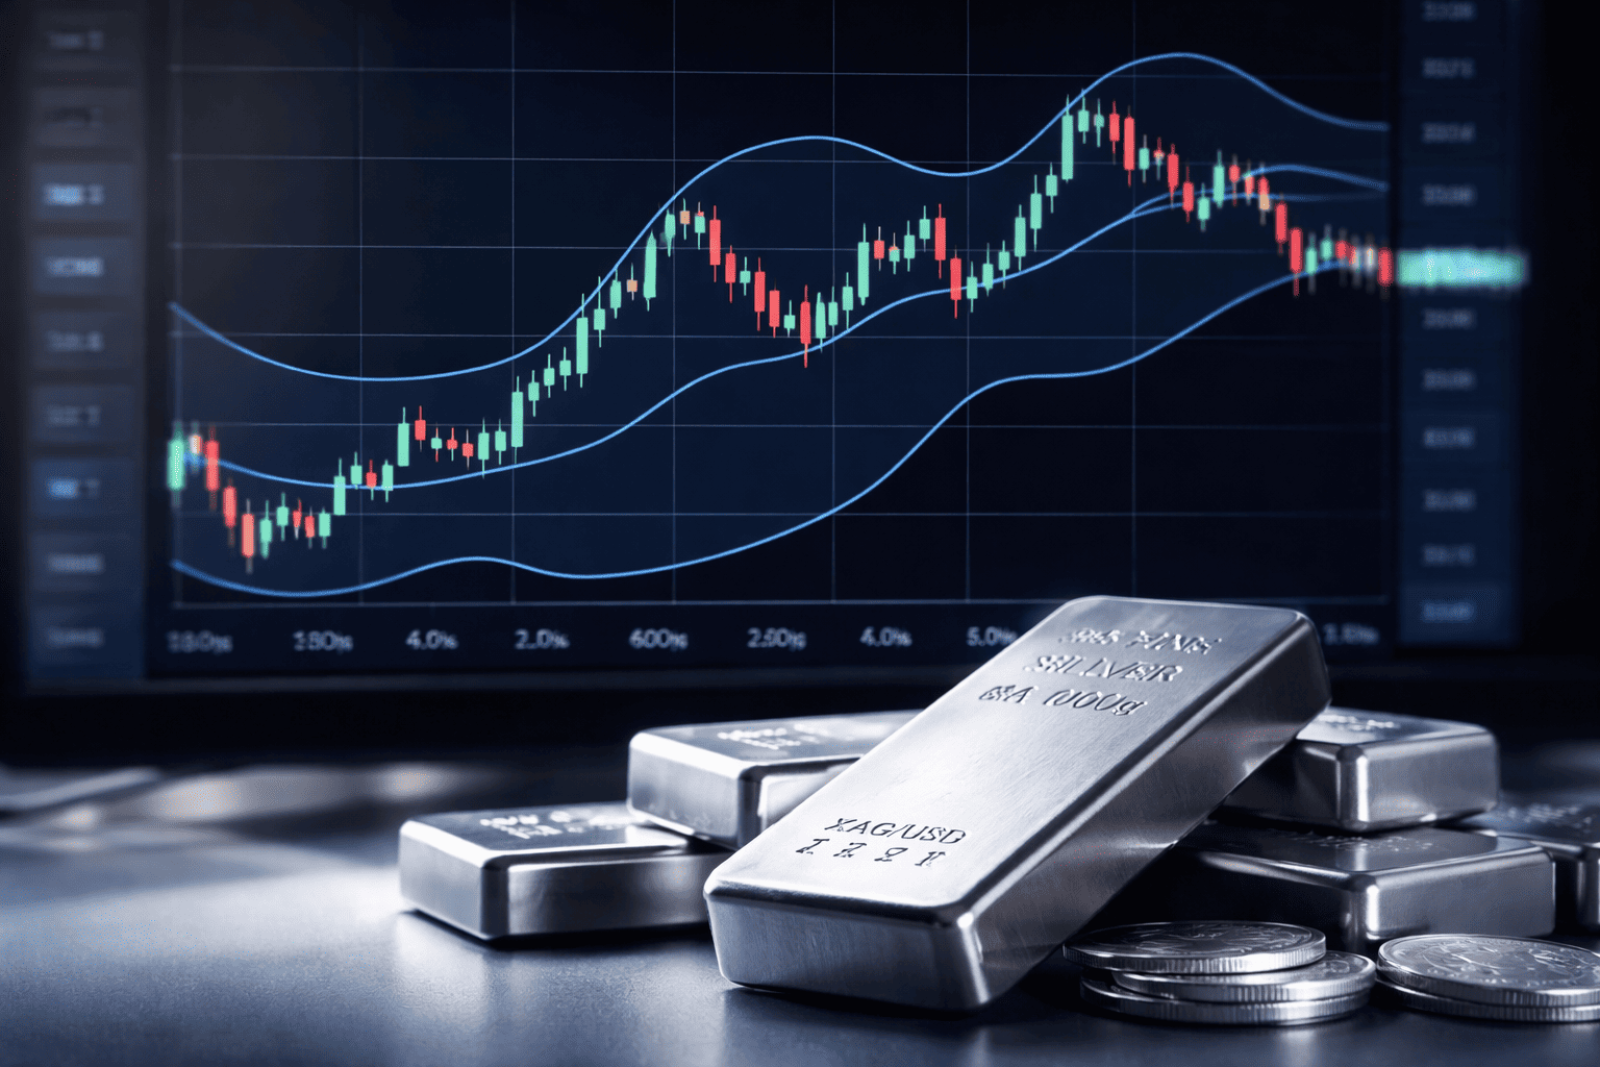
The monthly chart for silver (XAG) reveals a clear pattern - prices climbed aggressively before bumping into the upper Bollinger Band near the $88-90 zone. This technical ceiling proved too much to break through cleanly, triggering a retreat that's got traders reassessing their positions. The metal briefly poked above this key resistance level before sellers stepped in, pushing prices back down and highlighting just how strong the recent correction has been.
"Markets are correcting after an extended uptrend," as reflected in current silver volatility analysis, showing that what goes up must sometimes consolidate.
10-Month Rally Meets Natural Resistance
Silver's journey over the past months has been nothing short of impressive. The metal maintained a 10-month winning streak with RSI readings hitting levels not seen since 1980, climbing to 93.42 at the peak. But even the strongest trends need to pause, and that's exactly what we're seeing now.
Despite the pullback from the upper band, silver is still trading well above where it started this rally. The structure remains bullish - this is profit-taking and repositioning, not a collapse. The metal is currently consolidating in the 86-89 range as it eyes the next major resistance at $90.60.
What the Bollinger Bands Tell Us About Silver's Next Move
The interaction between silver and its Bollinger Bands matters more than you might think. When a commodity spends time pressing against the upper channel, it signals both strength and overextension. The current retreat suggests the market is digesting recent gains rather than preparing for an immediate continuation higher.
How silver handles support near the middle Bollinger Band will likely determine what comes next. If it can hold these levels while volatility settles, the foundation could be set for another leg up. The technical signals from these bands aren't just chart decoration - they're giving us a roadmap for potential directional shifts as the market weighs industrial demand and broader economic factors.
The metal's ability to stay elevated even while cooling off shows underlying strength that shouldn't be ignored.
 Marina Lyubimova


