 Saad Ullah

⬤Silver is flashing technical warning signs after closing below its 20-week moving average, a level traders have long watched as a momentum gauge. The weekly close beneath this threshold marks a meaningful shift from the rally that once had silver threatening the $100-$110 region, with price now pulling back sharply and short-term trend support giving way.
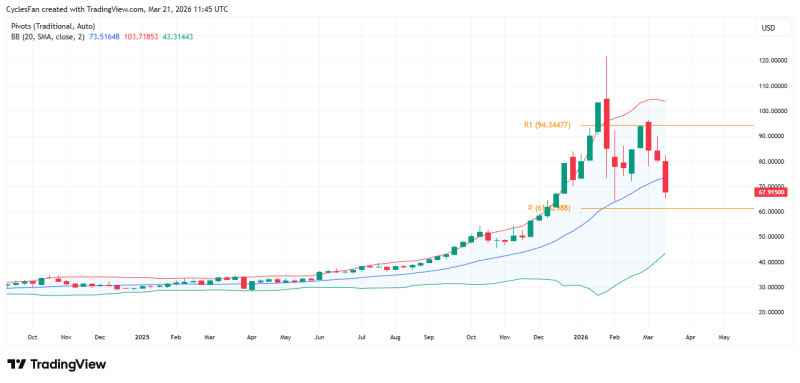
⬤The chart shows a clean rejection near recent highs followed by a steep drop toward the $67 area. Trading below key trend indicators, XAG is reinforcing what looks like a corrective structure. The 20-week MA breakdown aligns with patterns seen in prior silver cycles, where the metal loses trend support and begins retracing toward major pivot levels, a dynamic also covered in the XAG/USD resistance analysis at $50.23.
⬤The next critical level is the yearly pivot at $61.33. A move to that zone would fit the current downward trajectory and mirrors historical corrections where silver tests key demand areas before finding footing. If $61 fails, the following downside target sits near $50, a historically significant zone also flagged in the silver trendline analysis near $72.
⬤The broader takeaway is a clear transition from bullish continuation to corrective behavior. Losing the 20-week MA and continued selling pressure point to mounting structural stress. How silver reacts around $61 and $50 will likely define whether this is a healthy pullback or the start of a deeper trend reversal.
 Saad Ullah


