Peter Smith

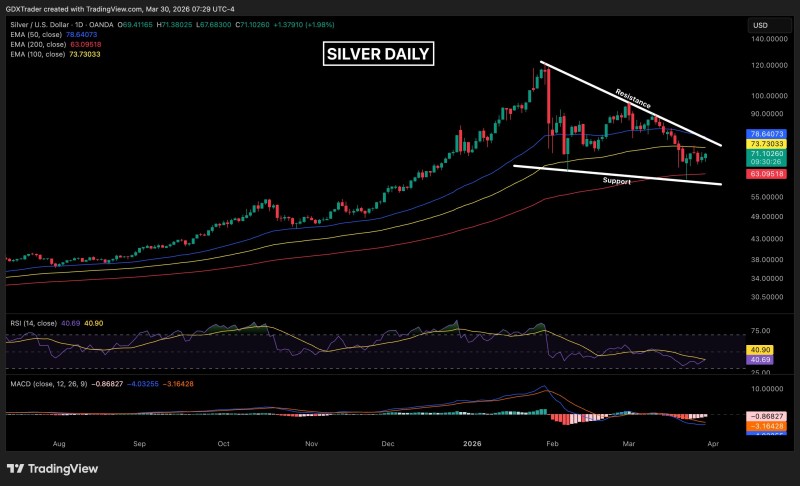
Silver is trading in a tight range, reflecting a lack of clear directional conviction as price consolidates below key moving averages. According to @GDXTrader, the current candle structure reflects ongoing consolidation rather than trend continuation. The structure shows compression within a wedge formation, suggesting a potential expansion once the range resolves.
Silver Price Sideways Action Reflects Lack of Conviction
Silver continues to print inside-range price action, signaling indecision in the market. Price remains capped below the 100 EMA, reinforcing the short-term pressure from overhead resistance.
The current candle structure reflects ongoing consolidation rather than trend continuation.
This aligns with broader market behavior, where silver often enters a compression phase before a larger move develops. A similar pattern has been observed recently, with silver trading in a tightening range below resistance while lacking directional clarity.
Silver Wedge Structure Signals Compression
The chart outlines a narrowing wedge formation, where price is squeezed between descending resistance and rising support. This type of structure reflects declining volatility and increasing pressure.
The setup is defined by:
- Lower highs pressing against trendline resistance
- Support holding near the lower boundary
- Price moving sideways within a tightening range
Wedge formations in silver have consistently preceded larger breakout moves, making the current compression phase one to watch closely.
This compression dynamic is consistent with recent technical setups in silver, where wedge formations have preceded larger breakout moves.
MACD and RSI Show Early Momentum Shift in Silver Price
Despite the sideways movement, underlying indicators are beginning to stabilize. Two key signals stand out:
- MACD has stopped declining and is flattening
- RSI is forming higher highs despite range-bound price
These signals suggest that while sellers still hold the edge due to price positioning below key EMAs, momentum may be starting to shift beneath the surface. Similar momentum stabilization has recently been observed as MACD begins improving after consolidation phases.
When MACD flattens and RSI pushes higher highs while price stays flat, it often signals that selling pressure is quietly exhausting itself.
Resistance Cluster Remains the Immediate Barrier
Any upside attempt will face immediate resistance from multiple technical levels stacked above price. These include the 100 EMA, a descending 50 EMA, and trendline resistance.
This creates a layered barrier where:
- Weak bounces are likely to be rejected
- Strong moves are required to shift structure
- Breakout confirmation depends on reclaiming moving averages
Silver remains compressed within its current range, with price action reflecting equilibrium rather than direction. The next move will likely depend on how price reacts when it tests this overhead resistance cluster. Silver stalled near $78.45 in a prior setup under similar conditions, offering a relevant technical parallel.
 Peter Smith