 Usman Salis

Silver is at a crossroads. After a strong longer-term rally, the metal has entered a phase of compression on the daily chart, with price caught between nearby support and the resistance of its key moving averages. The question now is whether this pause turns into a base for the next leg higher, or a setup for a deeper pullback. Here is what the charts are showing.
Silver Holds Narrow Range as Bulls Fail to Reclaim Key Moving Averages
Silver is grinding sideways. On the daily chart, XAG/USD printed a spinning top candle near $78.45, a textbook sign of indecision as neither buyers nor sellers can take control. The 21 EMA sits just overhead at $79.07, with the 50 EMA offering heavier resistance around $82.35.
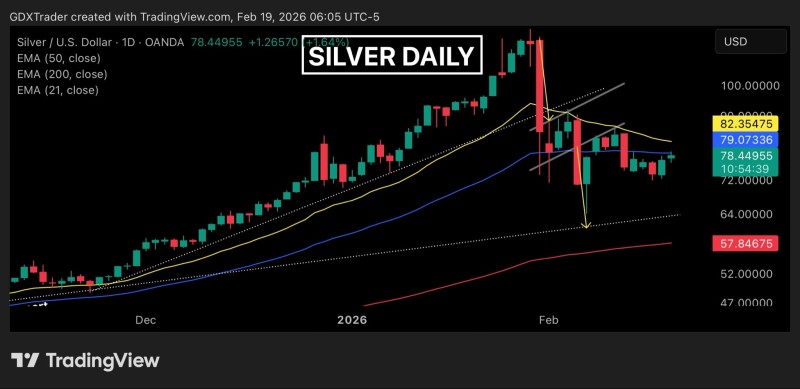
Bulls have managed to stabilize price, but they're still struggling to reclaim the 50 EMA, which is acting as the main near-term resistance level.
Lower Highs and 200 EMA Context Point to Extended Consolidation
Despite the broader uptrend still being intact, the latest sequence of lower highs and lower lows tells a more cautious story. Trading below both short- and medium-term EMAs points to a momentum pause rather than a clean continuation. A similar dynamic was covered in Silver Price Analysis: Bearish Consolidation Below $100 with Support at $71.81.
The 200 EMA is sitting far below current price near $57.85, which highlights just how extended the longer-term rally has been relative to where silver is trading now. That gap underscores why the current consolidation zone carries significance.
On the 4-hour chart, silver is testing clear resistance, which shifts the near-term focus away from daily setups. A comparable stall played out in Silver Price Tests Key 75-76 Support Zone as Breakout Builds, where price also hesitated near resistance before eventually picking a direction.
The daily read stays neutral for now. A reclaim of the 50 EMA would flip the short-term bias back to bullish, while a break below nearby support would confirm the correction is deepening. This mirrors the pattern explored in XAG/USD Drops 26% in Historic Daily Selloff, where loss of structure after compression defined the next directional move.
 Usman Salis


