 Eseandre Mordi

Silver has moved out of a prolonged corrective structure, with price breaking above a well-defined descending trendline. The chart suggests a transition from a bearish sequence into a potential new upward phase, aligning with broader technical patterns observed in recent silver analysis.
The Silver Break That Changed Structure
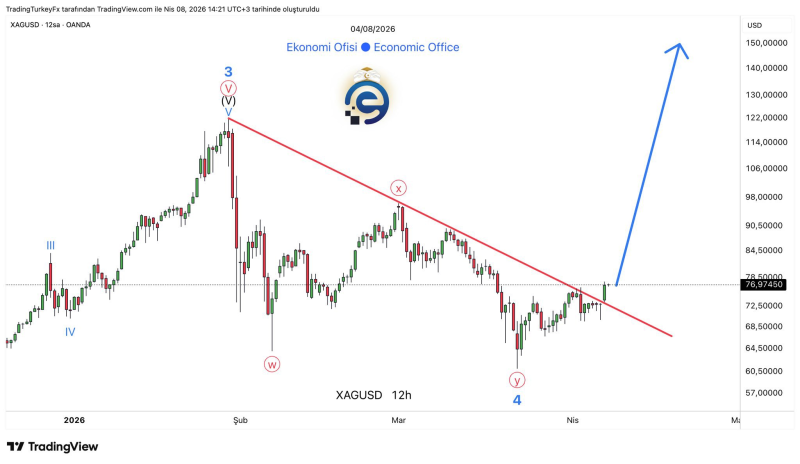
As Economic Office noted, the descending trendline on the 12-hour chart has been broken - a line that had consistently capped price since the prior peak, defining a clear sequence of lower highs.
The pattern of lower highs is no longer intact - bearish control has weakened, and the market is showing its first structural evidence of a directional shift.
On the chart, multiple rejection points align with this trendline, from the top formation above 110 down through subsequent lower highs near the 90 region. The breakout occurs around the 76-77 zone, where price pushes above the trendline and begins to stabilize.
From Silver Correction to Potential Impulse
The broader structure shows a completed decline followed by stabilization. Price forms a base after a sharp drop, then gradually builds higher lows leading into the breakout. This transition is consistent with a corrective phase ending and a new directional move beginning.
The key change is not just the breakout itself, but the shift in behavior - from rejection at resistance to acceptance above it. That distinction separates a genuine structural shift from a failed move that reverses back into the prior range.
Silver Triangle Setup Points to a $150 Long-Term Target laid out the longer-term case for this kind of expansion move well ahead of the current breakout, showing how the consolidation structure was building toward exactly this type of trendline resolution.
Why the Silver Breakout Zone Now Matters
The 76-78 region becomes the immediate pivot. Previously acting as resistance along the trendline, it now serves as a support zone following the breakout. Holding above this level suggests that the move is being accepted rather than rejected - price is currently consolidating just above this area, which often reflects a market preparing for continuation rather than reversing immediately.
A return below the 76-78 zone would weaken the breakout structure - but current price behavior shows stability above it, the more important signal at this stage.
Silver Targets $150 After Wave 4 Triangle provides the Elliott Wave context that frames this breakout as the beginning of wave 5 - the next impulsive leg higher following a completed wave 4 correction. That interpretation aligns with what the chart is showing structurally.
The $145-$150 Upside Path If Silver Structure Holds
The chart reflects an Elliott Wave interpretation where the prior move represents a completed wave 4 correction. If correct, the breakout signals the beginning of wave 5 - with the 145-150 range identified as a potential target.
Silver Price Prediction Elliott Wave Pattern Targets 150 reinforces that projection with comparable analysis, showing how similar consolidation structures and breakouts have preceded large upside expansions in silver across prior cycles.
At this stage, the structural case is in place. Whether it develops into a sustained bull phase depends entirely on how silver behaves in the sessions ahead - and specifically whether the 76-78 breakout zone continues to hold as support.
 Eseandre Mordi


