 Saad Ullah

Platinum's recent recovery is showing signs of exhaustion as price compresses near a key trendline, raising the risk of a shift in control. After breaking a descending trendline and reclaiming the 50 EMA, the market has failed to follow through - instead forming a tightening structure where sellers are starting to reassert pressure, according to GDXTrader.
The Platinum Breakout That Failed to Extend
The chart clearly shows that platinum pushed above a descending resistance line while reclaiming the 50 EMA - a combination that typically supports bullish continuation. However, instead of accelerating higher, price stalled as it approached an ascending trendline. Buyers who stepped in during the breakout are now facing a much tougher environment as the structure shifts beneath them.
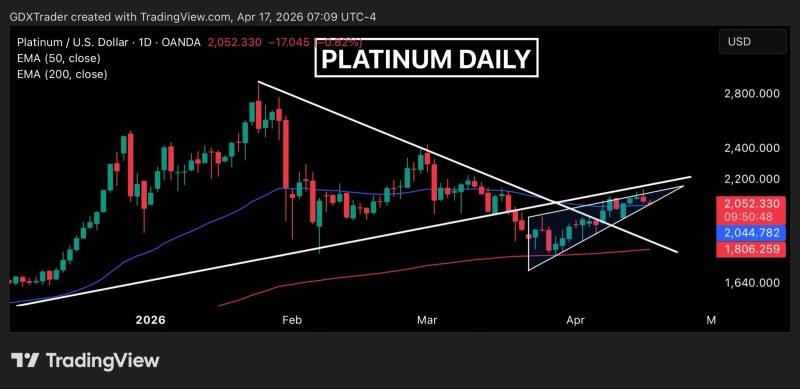
The market is no longer trending cleanly higher but instead compressing between converging trendlines, signaling indecision and weakening momentum.
This lack of follow-through is central to the current setup. The market is no longer building higher with any conviction, and the compression between converging lines is the clearest sign yet that something has changed. Related context: Platinum Reclaims 50 EMA Inside Wedge Structure.
Platinum Candles Signal a Shift in Control
The transition from bullish to bearish pressure is reflected directly in recent candlestick formations. The sequence includes a shooting star, followed by a bearish engulfing candle, and then a continuation move lower. This is not noise - it is a readable story of fading buyer conviction playing out bar by bar.
Price is now retesting the 50 EMA from above - a critical dynamic that often determines whether a breakout holds or fails.
This progression points to a gradual loss of buyer control. The behavior aligns with a distribution phase, where selling begins to appear at higher levels as bullish conviction fades. Traders watching Platinum Breakdown Below 50 EMA Signals $1,770 Risk will find the current setup familiar.
Compression and MACD Signal Downside Platinum Risk
Structurally, the pattern forming on the chart resembles a rising wedge - a setup commonly associated with weakening trends and downside risk if support breaks. Momentum indicators referenced in the source, specifically a slowing MACD histogram and declining rate of change, reinforce the same idea: the market is no longer accelerating upward.
A breakdown could open the door for a deeper move if support fails - price remains above the 200 EMA, but the distance from that longer-term indicator leaves room for a significant shift.
Platinum is now positioned at a technical crossroads where structure and momentum are no longer aligned with the earlier breakout. The next move from this compressed range will likely determine whether the trend stabilizes or shifts further toward sellers. For additional background, see Platinum Holds Support After Triangle Breakout.
 Saad Ullah


