 Artem Voloskovets

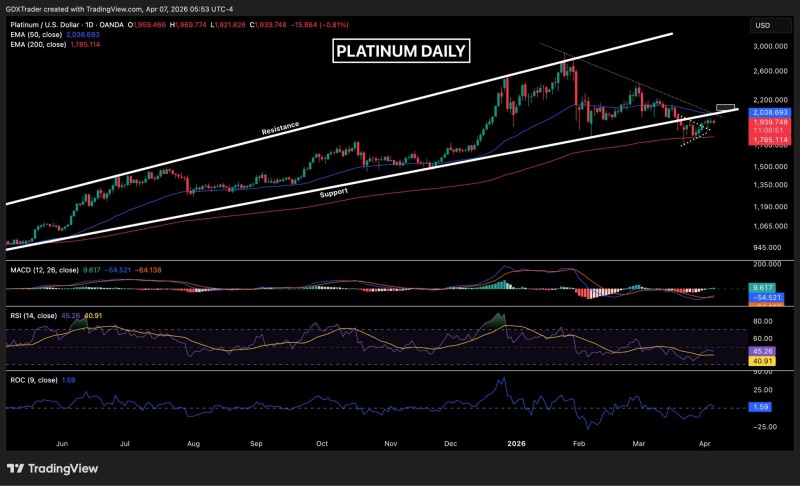
Platinum is showing clear signs of exhaustion near resistance, with price unable to reclaim key levels after a recent pullback. The chart highlights a market stuck below a critical resistance cluster - momentum remains weak and buyers are not stepping in with urgency. GDXTrader flagged the setup, pointing to a structure that has shifted decisively against the bulls.
The chart confirms this shift. Price is pressing into the underside of the structure but failing to break through, reinforcing the idea that former support is now acting as supply. This aligns with broader platinum technical setups where platinum breakdown below 50 EMA signals downside risk, reducing the odds of a clean recovery in the near term.
Platinum is trading below the 50 EMA and prior support from the ascending broadening wedge, which has now turned into resistance.
The Platinum Level That Flipped Into Resistance
As the chart shows, platinum lost the ascending broadening wedge structure and failed to reclaim the 50 EMA - both of which have now flipped from support into active resistance. This kind of structural role reversal is significant. Once a zone that buyers defended, it is now a ceiling that sellers are defending with equal conviction.
The failure to push back above these levels is not a single-candle anomaly. It reflects a consistent pattern of sellers absorbing any rally attempt and capping the price before it can build real upside momentum.
Platinum Price Signals Weak Buyer Presence
Recent price action reflects hesitation rather than strength. A doji candle at resistance highlights indecision, while the following narrow-range candle confirms a lack of bullish follow-through. There is no evidence of strong buying pressure reclaiming levels. Instead, price continues to stall beneath resistance - demand remains limited at current levels.
A doji candle at resistance highlights indecision, while the following narrow-range candle confirms a lack of bullish follow-through.
The setup also reflects the presence of trapped buyers from higher levels. As price remains below resistance, these participants may look to exit positions during any bounce. This dynamic adds additional selling pressure, particularly in a market where upside momentum is already limited. Analysis tracking platinum RSI divergence confirming correction phase structure supports the same thesis - the internal mechanics of the move favor continued downside.
Descending Platinum Resistance Reinforces the Ceiling
The chart also shows descending resistance overhead, creating a layered resistance cluster. This adds to the difficulty for price to move higher, as multiple technical barriers converge in the same region. Key factors reinforcing the bearish setup include:
- Price trading below both the 50 EMA and the broken wedge structure
- Doji and narrow-range candles signaling indecision at resistance
- Descending resistance forming a layered ceiling overhead
- Weak momentum indicators offering no bullish divergence
- Trapped buyers from higher levels adding passive selling pressure on any bounce
At the same time, momentum indicators remain weak, reinforcing the idea that the market lacks the strength to push through resistance. This structure is consistent with broader patterns where platinum pullback within long-term channel remains part of broader cycle - the corrective phase may still have room to develop before any meaningful reversal takes shape.
Until price can reclaim the resistance cluster and move back above it, the structure continues to favor sellers - patience remains the dominant approach.
Until price can reclaim the resistance cluster and move back above it, the structure continues to favor sellers. For now, patience remains the dominant approach - waiting for a confirmed reclaim rather than chasing an uncertain bounce into overhead supply.
 Artem Voloskovets


