Usman Salis

⬤ The Oil/Gold ratio, which measures crude oil's performance relative to gold (XAU), is approaching a key technical breakout zone. A long-term chart shows a two-week bullish divergence forming as the ratio tests a descending resistance line that has capped multiple rallies in recent years. Similar divergences in the past appeared shortly before the ratio broke above diagonal resistance and accelerated higher.
⬤ Previous bullish divergences on the momentum indicator developed near major turning points in the ratio. In several past cycles, these patterns formed as the ratio made lower lows while momentum began rising. The Oil/Gold pair then moved higher after breaking trendline resistance each time. Because the ratio reflects relative strength between energy markets and gold (XAU), shifts in this relationship are widely read as signals of changing macro risk appetite.
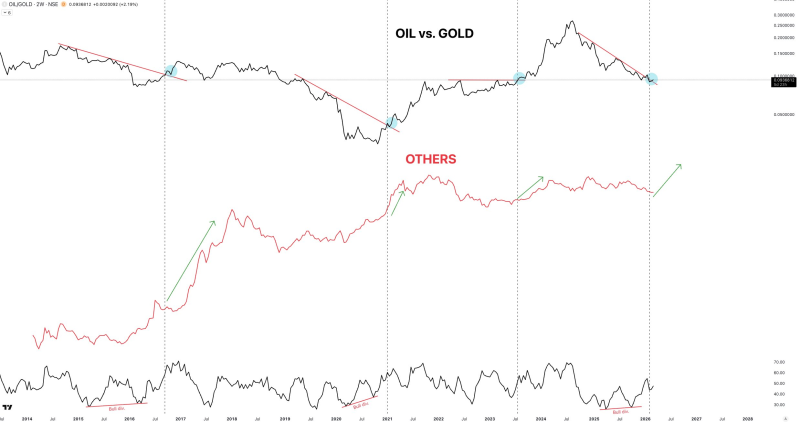
⬤ Historical chart patterns suggest each Oil/Gold breakout preceded stronger performance in speculative market segments. The "OTHERS" index representing altcoins appears to rise during these phases. Analysts monitoring cross-market dynamics often use commodity ratios to gauge capital flow shifts, as also examined in Gold/Silver Ratio: A Decade-Defining Setup, where ratio breakouts are shown to precede large price expansions in related assets.
⬤ If the current breakout attempt in the Oil/Gold ratio continues developing, it could signal strengthening economic momentum and rising demand for growth-sensitive assets relative to safe havens like gold. Such macro shifts have historically coincided with stronger performance across higher-beta market segments. Similar commodity-driven signals were also explored in Silver Hits $54 as Key Ratio Signals Potential Breakout, where analysts showed how ratio movements can trigger broader trends across financial markets.
⬤ The appearance of another bullish divergence on the Oil/Gold chart places attention on whether the ratio can decisively break its long-term resistance. If the pattern follows the previous cycles documented in the chart, the move could coincide with renewed momentum across risk assets, while the balance between commodities and safe-haven positioning continues to shift.
 Usman Salis