Peter Smith

Oil may be rising again, but the bigger picture tells a far more restrained story. According to Daniel Lacalle, a multi-decade chart puts current prices well below prior crisis peaks - reinforcing the view that both nominal and inflation-adjusted oil remain far from historical extremes.
Both nominal and inflation-adjusted oil prices remain far from historical extremes, with current levels still sitting closer to long-term averages than to prior crisis highs.
3 Oil Price Peaks That Define the Long-Term Ceiling
The long-term chart identifies three major reference points that have defined oil's upper boundary over the past two decades. The 2008 crisis stands as the highest point on record, marking the extreme upper limit.
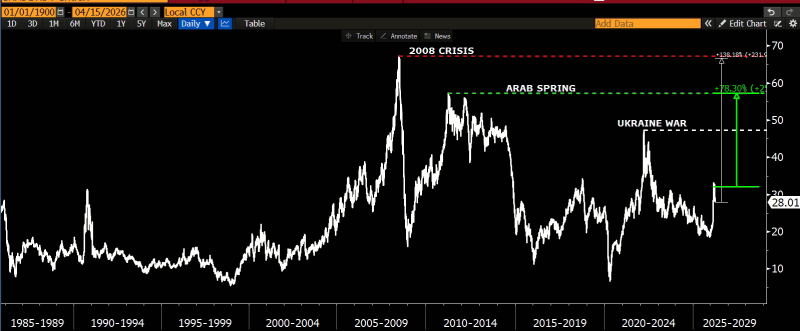
The Arab Spring rally reached a secondary ceiling - significant but clearly lower. Most recently, the Ukraine war spike failed to match either of those prior highs, topping out at a meaningfully weaker level.
This sequence forms a clear hierarchy of resistance across decades, with each major geopolitical shock producing a weaker upside extension than the one before it. WTI Crude Oil surged above $84 for the first time since July 2025, yet even that move left prices firmly below the levels reached during past crises.
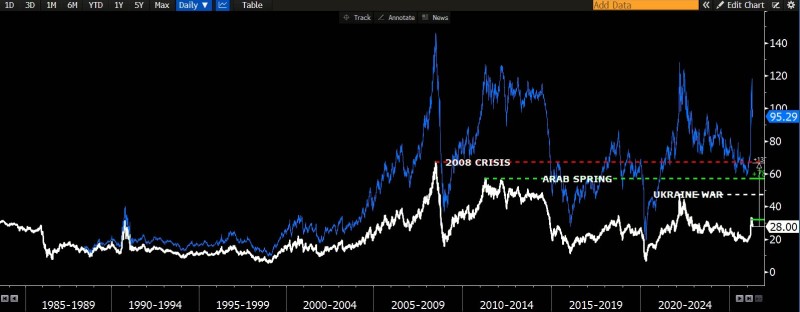
Oil Prices Still Well Below Historical Crisis Highs
Current oil price levels remain well below those crisis-driven peaks. Even with the latest rebound, oil is positioned closer to the lower half of its long-term historical range rather than anywhere near the extremes reached during 2008 or the Arab Spring. This aligns with broader market data: Brent Oil is up 67% in 2026, yet real prices stay near the 25-year average - a clear reminder that strong nominal moves do not automatically signal historically elevated conditions.
- 2008 crisis peak - highest point on the multi-decade chart, the extreme upper boundary
- Arab Spring rally - a secondary ceiling, significantly below the 2008 high
- Ukraine war spike - failed to match either prior high, topping out at a weaker level
- Current prices - sitting closer to the lower half of the long-term range
A Market With Room to Run Before Testing Oil's Upper Range
The structure shown in the long-term chart is not about short-term volatility. It is about where prices sit relative to a multi-decade range - and the answer is: still far from the top. Oil continues to react to global events, but those reactions are producing progressively weaker peaks compared to earlier cycles. WTI Oil breaks $84, with key oil resistance levels at $87 and $95 now in focus - though even reaching those targets would leave prices well short of historical extremes.
Even if prices continue moving higher, there is still a substantial gap between today's market and the extremes reached during past crises - the upper range of oil's long-term history remains untested.
The chart makes one point clear regardless of short-term direction: there is still a substantial distance between current levels and the peaks that defined oil's most extreme historical moments. Whether the current rebound extends or stalls, that gap remains the defining feature of where oil stands today.
 Peter Smith