Artem Voloskovets

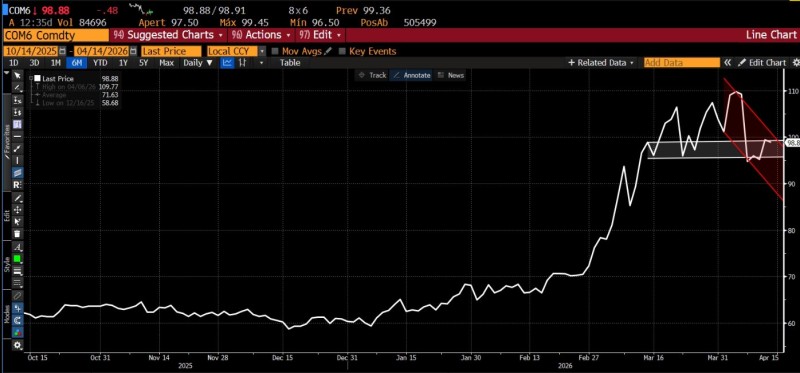
After an impressive rally from the low-$60s into triple-digit territory, crude oil has shifted tone. As Daniel Lacalle observed, oil prices are now declining as markets begin discounting the possibility of fresh diplomatic talks. The chart confirms it: price failed to hold its breakout above $110 and has since rolled into a descending corrective structure.
Why Oil's Pullback Toward $95 Is Telling a Different Story
What makes this reversal notable is not the size of the move but the timing. The late-March spike above $110 was brief. Price quickly slipped back into a lower-high pattern, which typically signals that buyers are losing control even when the broader price level stays elevated. That is exactly the kind of behavior that tends to follow a sentiment shift rather than a fundamental supply shock.
Markets are discounting a new round of negotiations, and oil prices are reflecting that shift before any official confirmation arrives.
The retreat is happening in a context where US pressure tied to the Strait of Hormuz is still active. That makes the price action all the more meaningful. Traders are not ignoring the geopolitical backdrop. They are suggesting the market can handle more of it than the headlines imply. WTI Oil Pulls Back From $110-$115 Resistance as Momentum Fades examines a very similar rejection from the same resistance zone in more technical detail.
Oil Compresses Between $95 and $100 as the Market Seeks Direction
Right now, crude is not breaking down in any structural sense. It is compressing inside a downward-sloping channel and trying to stabilize in the $95-$100 area. That gray zone on the chart is functioning as a near-term balance range, where the market is effectively deciding whether the current decline is just a pause or the opening leg of a deeper reset.
The market is not pricing out risk. It is pricing in the idea that supply can be rerouted and that the worst-case scenario is less probable than feared.
Oil had already rallied sharply into April, so some degree of correction was always part of the picture. The question is whether the $95-$100 zone can hold. A clean bounce from here would support the pause narrative. A sustained break below it would open the door to a more meaningful correction toward the mid-$80s. WTI Oil Breaks Above $100: Can the Rally Hold or Will It Stall? covers the market's struggle to maintain upside after the initial breakout.
Forward Curve Backwardation Keeps the Supply Story Alive
Despite the front-month softness, the forward curve remains in steep backwardation. That is a signal worth paying attention to. Backwardation means near-term supply is still being priced tighter than longer-dated contracts, which tells you the market has not completely walked away from its bullish supply thesis.
The forward curve staying in steep backwardation suggests near-term tightness has not disappeared, even as the spot price corrects.
In other words, this pullback looks more like repositioning than capitulation. Traders are scaling back their exposure to extreme disruption risk while still acknowledging that supply conditions in the near term remain historically snug. That combination of a softening spot price and a firm forward curve is exactly the kind of mixed signal that tends to keep markets cautious rather than directionally committed.
For full context on where the rally came from, Oil Hits Highest Weekly Close Since 2022 as Crude Tests $112 Resistance covers the earlier phase of the same move before the latest correction took hold.
 Artem Voloskovets