 Saad Ullah
Natural gas keeps trading inside a well-defined low base range, with price action showing no decisive move in either direction. Writing for thetradable.com, the analyst behind the chart points out that price remains below the 21 EMA - a key factor keeping the broader structure tilted to the downside, despite a recent bullish continuation candle that pushed NATGAS back toward the middle of the range.
NATGAS Low Base Pattern Signals Persistent Weakness
The chart shows NATGAS consolidating inside a horizontal box following a decline - a setup commonly described as a low base pattern. Price is pinned below the 21 EMA while all major moving averages continue trending downward, reinforcing the bearish backdrop.
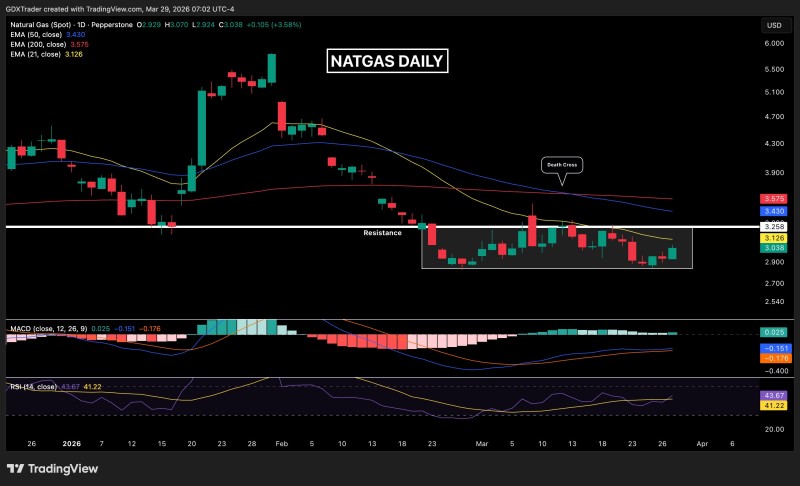
Price remains below the 21 EMA, keeping the broader structure weak despite a recent bullish continuation candle that pushed price back toward the middle of the range.
A death cross is clearly visible on the chart, with shorter-term averages crossing below longer-term ones. This adds another layer of confirmation to the bearish pressure. Natural gas is effectively capped below resistance in the $3.20-$3.25 zone, where sellers have maintained control.
Why Mid-Range Is Not a High-Probability NATGAS Entry
The recent bullish candle brought price back to the center of the range - but that is not where high-probability setups form on the daily timeframe.
The chart identifies three distinct zones:
- Lower boundary where buyers previously stepped in
- Upper resistance near $3.25
- Mid-range where price currently sits
Trading from this mid-range lacks edge, as price is equally likely to rotate in either direction without confirmation.
With price caught between levels, the risk-reward simply does not favor a directional bet until one side takes control.
NATGAS Death Cross and Descending Averages Cap Any Upside
While the daily structure stays weak overall, shorter-term strategies have centered on trading the extremes of the range. Buying near the lower boundary has produced bounces - but these are tactical moves rather than signals of a structural reversal.
From the higher timeframe, this is consolidation within a downtrend. Overhead resistance and descending moving averages continue to limit upside potential until price can push through and hold.
This remains consolidation within weakness. Resistance overhead and descending moving averages limit upside until proven otherwise.
A Market Waiting for Direction
The current NATGAS setup reflects a market in equilibrium - neither bulls nor bears have full control. The only signal that would change the picture is a clean breakout above resistance with genuine follow-through.
Until that happens, the structure stays the same: consolidation below $3.25, patience required, and no clear edge in the middle of the range.
 Saad Ullah


