Eseandre Mordi

Natural gas has shifted into a choppy consolidation phase, with price hovering near a critical support zone. As ArcisFX noted, the market is entering a "chop zone," where stability above $2.50 - or slightly lower toward $2.45 - becomes the key condition for short-term structure.
Price is entering a chop zone where stability above $2.50 becomes the defining condition for near-term structure.
This transition suggests a slowdown in directional momentum and a potentially frustrating phase for traders.
Natural Gas Shifts From Trend to Compression
The chart reflects a clear loss of upward momentum following the recent rejection from higher levels. After failing to sustain moves above the $4.00-$5.00 region, price has rotated lower and is now compressing into a tighter range.
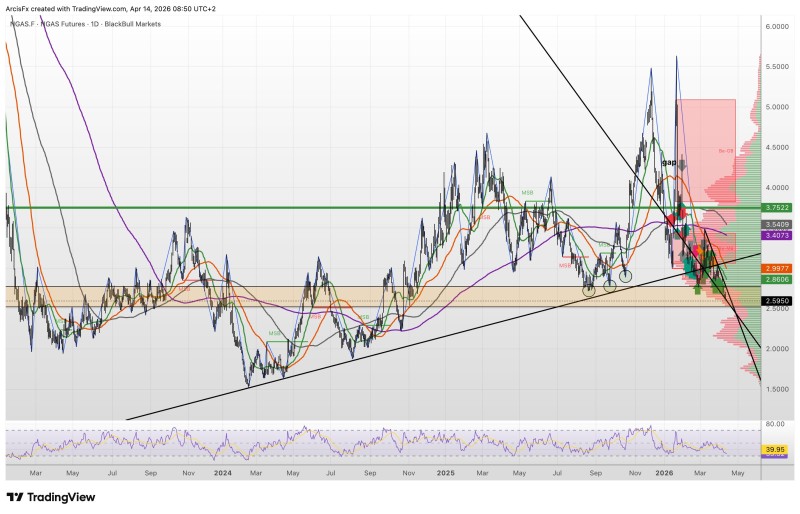
Instead of clean trending behavior, the structure has evolved into overlapping swings and reduced follow-through. This is typically a sign that the market is transitioning from a directional phase into consolidation, where both buyers and sellers are active but neither side is in control. Natural Gas Tests $3 Support After 8% Drop offers useful context on how prior directional phases resolved.
The breakdown below key moving averages reinforces this shift. Price is now trading beneath these dynamic levels, which are beginning to act as resistance rather than support.
A Key Natural Gas Floor at $2.50-$2.45 Is Being Tested Repeatedly
The $2.50-$2.45 area stands out as the most important zone on the chart. It aligns with prior reaction levels and is now being tested as a potential base.
Price has approached this region multiple times, forming a cluster of reactions rather than a sharp bounce. This behavior is consistent with what traders describe as a basing process - a phase that often takes time and lacks clear direction. For additional context on how similar zones have played out, see Natural Gas Holds $2.86-$2.93 Micro Support Zone.
Why This Chop Phase in Natural Gas Could Drag On
The defining characteristic of the current setup is not weakness alone, but indecision. Candles are overlapping, momentum indicators are flattening, and volatility is compressing - all classic signs of a range-bound environment.
The near-term setup is defined by indecision - momentum is flat, volatility is compressing, and neither buyers nor sellers are in control.
This aligns directly with the idea that the market may become "annoying" in the near term. Instead of sharp moves, traders may face extended periods of false starts and short-lived breakouts. Natural Gas Drops Below $4 as Market Tests $3 Support Zone illustrates how past consolidation phases near major levels have played out before resolution.
Where Natural Gas Structure Can Break Next
As long as price holds above $2.50, the market remains in a basing attempt rather than a confirmed continuation lower. However, a sustained move below $2.45 would signal that buyers are no longer defending the zone, potentially opening the door to further downside.
Broader price behavior in recent months shows that once key support zones fail, natural gas can quickly transition into deeper declines - especially after losing major psychological levels.
For now, the structure is defined not by trend, but by negotiation around support - a phase where patience tends to outweigh conviction.
 Eseandre Mordi