Saad Ullah
Gold is testing a critical technical level after a steep drop from recent highs, with price now sitting directly on a long-standing rising trendline. According to Gold Predictors, the metal is holding above a key support zone - raising the possibility that a base may be forming rather than a deeper breakdown.
The Retest That Keeps the Gold Trend Alive
The chart shows a clear long-term uptrend, defined by a steady sequence of higher highs and higher lows.
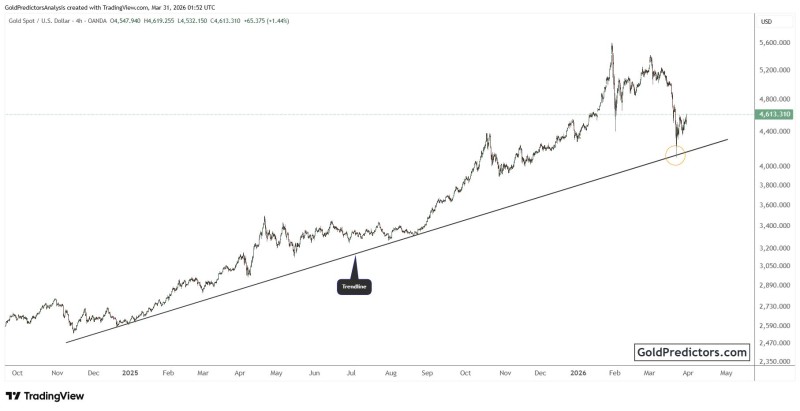
This structure has been supported by a rising trendline stretching back across multiple months.
Price is not breaking below support but instead holding just above it - reinforcing the importance of this level.
Following a sharp rejection from the highs, gold sold off aggressively before stabilizing near this trendline. The reaction is precise, and the trendline is holding exactly where it should. Gold Holds Above $4,000 as Price Retests Key Trendline After Major Rally highlighted comparable behavior in similar setups, where the trendline acted as a reliable floor before continuation.
Where Gold Price Finds Its Footing
After the decline, price action becomes more controlled near the support zone. The chart highlights a clear holding pattern rather than continued downside expansion.
The key observations are straightforward:
- Price remains above the rising trendline
- No confirmed breakdown structure is visible
- The reaction area aligns with prior support behavior
The market is no longer trending downward aggressively but instead stabilizing around support - exactly the behavior that precedes a base formation.
This aligns directly with the idea of a potential base forming. The metal is not collapsing through support - it is compressing against it. A similar rebound structure was outlined in XAU Rebounds From $4,100 Support, Eyes $5,000 Break, where consolidation near a key level preceded a meaningful recovery.
A Gold Structure That Has Not Broken
The broader technical structure remains intact as long as gold continues to hold above this ascending support line.
The trendline acts as the defining boundary. A sustained hold keeps the bullish structure valid, maintaining the pattern of higher lows. A break below it would represent a structural shift - but that is not currently visible on the chart.
Momentum compression near support often precedes expansion - and right now, gold is doing exactly that.
At this stage, gold is not showing signs of confirmed reversal. Instead, it is testing whether the existing trend can sustain itself. As seen in Gold Breaks Triangle Pattern With $4,830 Target, consolidation near support has previously resolved into sharp directional moves - making the current setup one worth watching closely.
 Saad Ullah