 Alex Dudov

⬤ Gold is locked in a strong downtrend on the hourly chart, with price pushing toward the $4,270 region following a string of consecutive breakdowns. A brief reaction from the 2.618 Fibonacci level failed to hold, and recent candles show lower wicks with no confirmed reversal structure, leaving sellers firmly in control, as Forex Sinyal Merkezi noted in Gold Drop Below $4,500 Keeps Bears in Control as $4,550 Becomes Key.
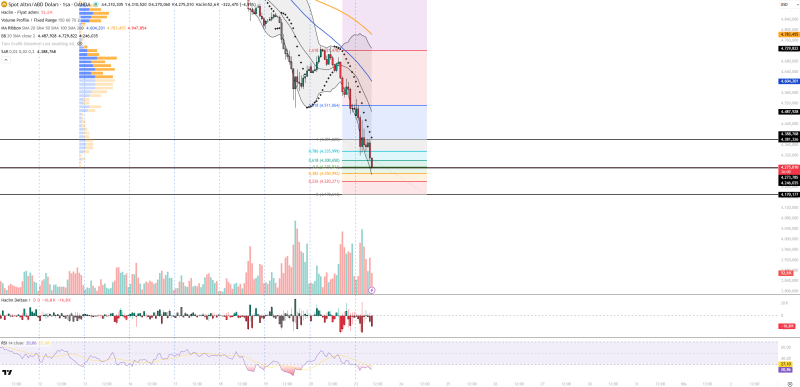
⬤ The technical picture remains decisively bearish, with price printing lower highs and lower lows across the board. Key resistance sits at $4,300, $4,335, and $4,380, while support targets cluster at $4,270, $4,250, and $4,220. Trading below the volume profile point of control confirms sell-side dominance. A structural breakdown pattern similar to this was analyzed in Gold Breaks Structure, Eyes $4,290, where rejection from supply zones preceded further downside.
⬤ Indicator signals reinforce the bearish bias. RSI holds in the 20-30 range, signaling oversold territory without confirming a bottom. Volume spikes on bearish candles while delta stays negative. Bollinger Bands are expanding with price pressing the lower band - a classic continuation signal, not a reversal one.
⬤ Macro headwinds add pressure at the fundamental level. A strong U.S. dollar and elevated interest rates are suppressing gold's appeal, while geopolitical uncertainty offers only partial support underneath. As explored in Gold Drops 15% Despite War Debasement Trade Tested, even traditionally bullish macro conditions have failed to reverse the selling trend - leaving short-term momentum clearly in bearish hands.
 Alex Dudov


