 Marina Lyubimova

Gold is entering a critical technical phase as price compresses within converging trendlines just below recent highs. The chart highlights a tightening structure, suggesting that the next directional move could be significant as volatility contracts near the apex. According to Rashad Hajiyev, gold still has "a lot of work to do" - and the current chart reflects exactly that.
Gold Triangle Pattern Tightens Around $4,700
Following a strong uptrend, XAU/USD has transitioned into a symmetrical triangle pattern.
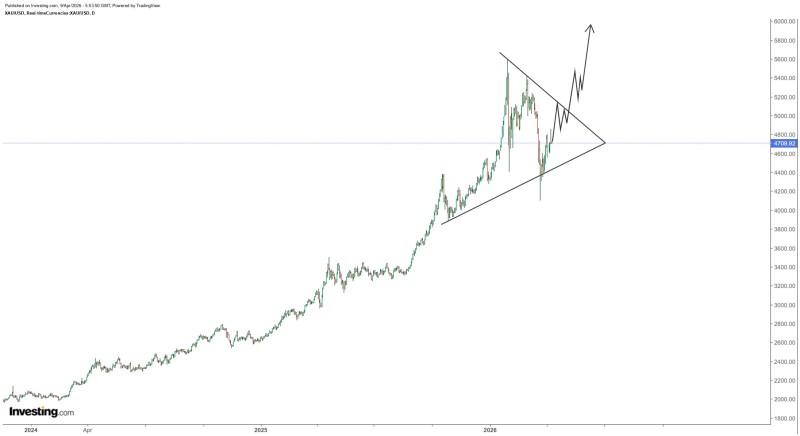
This formation is defined by rising support from higher lows and descending resistance from lower highs, converging near the current price zone around $4,700.
Gold still has a lot of work to do - compression rather than confirmation is what the chart reflects right now.
This is not a reversal signal by itself. Instead, it reflects a pause within an existing trend, where both buyers and sellers are gradually narrowing the range. The structure is doing what triangles do - coiling energy before releasing it in one direction.
Where Gold Price Keeps Getting Capped
The upper boundary of the triangle has repeatedly rejected advances, preventing gold from reclaiming its prior peak. Each attempt to break higher has resulted in a pullback, reinforcing the descending resistance line as a key barrier.
At the same time, the rising support trendline continues to hold, with price bouncing after sharp dips. This behavior confirms that buyers remain active, even as upward momentum slows. As recent coverage of Gold Holds Tight Range Between $4,600 and $4,670 shows, price is currently rotating within a defined range - reinforcing the idea of compression before expansion.
Gold (XAU/USD) Breakout Scenario Traders Are Watching
The projected path outlined on the chart shows a continuation move if price breaks above the descending resistance. However, the chart itself does not confirm timing or certainty - it only maps a potential path based on structure.
Similar setups have appeared in recent analysis. Gold Price Prediction: XAU Breakout Could Target $7,000-$8,000 by May 2026 describes a nearly identical triangle compression near highs, where price tightens before expansion. Likewise, Gold Price Analysis: Triangle Breakout Pattern Could Target $7,000 by Mid-May points out that similar triangle formations during this uptrend have historically resolved with strong upward moves.
What the chart is showing is a market that hasn't made up its mind yet - the decisive move comes only after price leaves the structure behind.
At this stage, gold remains inside the triangle, not outside it. The market is compressing, and the decisive signal will come only when price breaks convincingly beyond the triangle boundaries - in either direction.
 Marina Lyubimova


