 Marina Lyubimova

⬤ Gold prices stayed under pressure but the selling slowed down after the sharp drop from last week's highs. XAU fell about 12% from its recent peak—one of the steepest short-term pullbacks during this rally phase. Despite the continued downside, the slower pace suggests the most intense selling pressure might be easing.
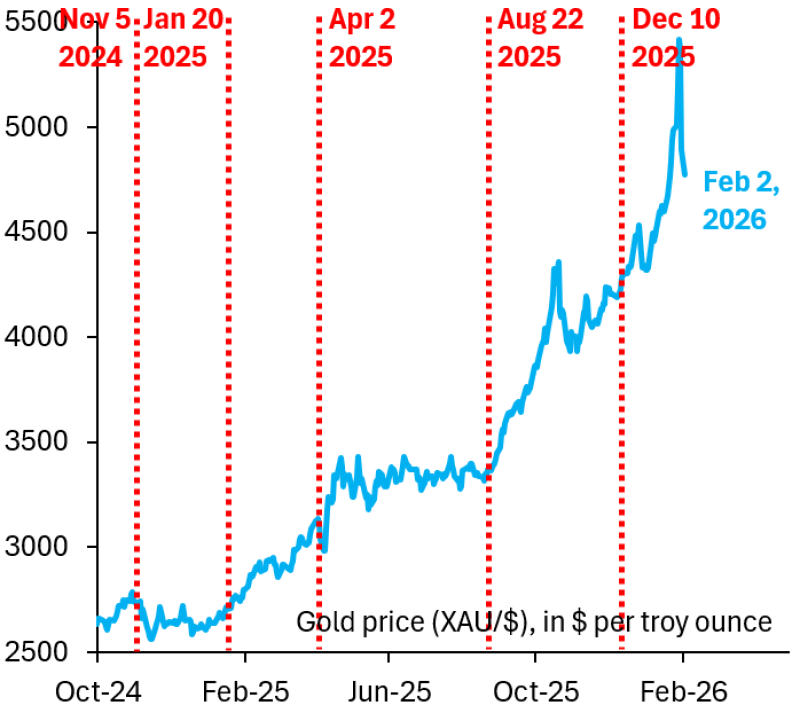
⬤ The chart reveals the recent selloff basically wiped out gains made since January 20. After climbing quickly through late 2025 and early 2026, gold peaked above $5,000 per ounce before reversing. The decline took back a chunk of that advance, putting current prices back inside a previous consolidation zone rather than breaking into fresh lows.
The deceleration in losses suggests the most intense selling pressure may be easing.
⬤ Recent price action shows the sharpest phase of the drop has already played out. Daily swings have gotten smaller compared to the initial selloff, pointing to reduced downside momentum. Volatility's still elevated, but the slower decline suggests a move away from forced or panic selling. Even after this correction, gold sits well above levels from earlier in the rally—the longer-term structure hasn't completely fallen apart.
⬤ This matters because gold's rise and pullback have been tied to worries about fiscal policy and currency debasement. When a correction stabilizes near earlier breakout levels, it can shift sentiment around whether the underlying trend has legs. As selling pressure cools, how gold trades around these levels will likely shape expectations for volatility and direction across precious metals markets.
 Marina Lyubimova


