 Marina Lyubimova

The shift is now clearly visible in long-term data. As Solix Trading noted, natural diamond prices have fallen more than 50% since 2022. The chart confirms this move, showing a steep decline from recent highs near the 6,500-7,000 range down toward the 3,000 level by 2025-2026.
The Long-Term Diamond Structure That Turned Lower
The chart shows that diamond prices have not been in a sustained uptrend for over a decade. After peaking around 2011-2012 near the 7,500-8,000 range, the market began forming lower highs - signaling weakening long-term momentum well before the recent collapse.
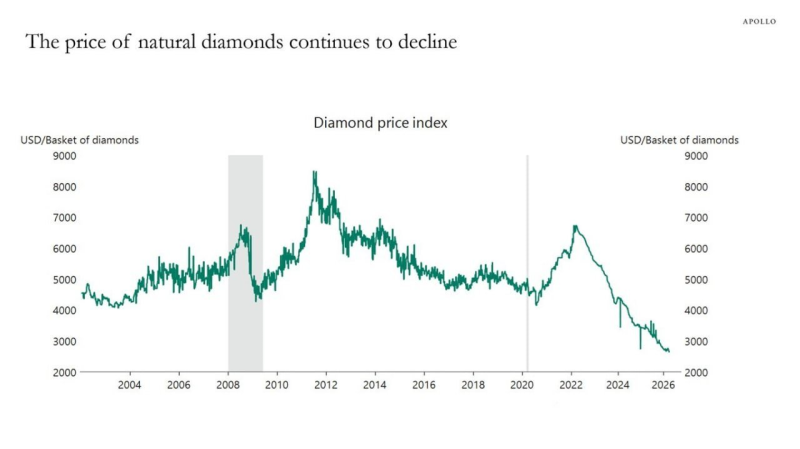
Subsequent rallies, including the move into 2021-2022, failed to break above prior peaks. Instead, each recovery attempt stalled at lower levels, reinforcing a gradual structural shift from growth to decline. The latest cycle confirms that transition, with the most recent peak clearly below earlier highs.
Where the Diamond Breakdown Accelerated
The decisive move came after the 2022 peak. From that point, the chart shows a sharp and continuous decline, with price breaking below the 5,000 level and then accelerating lower. Unlike earlier periods, this drop does not show a clear consolidation phase - the move extends downward with limited pauses, pushing the index toward new historical lows near 3,000.
This aligns directly with the more than 50% decline from recent highs - and the absence of any meaningful consolidation during the decline is itself a signal about the intensity of the repricing underway.
A Diamond Market That Lost Its Historical Floor
One of the most important signals on the chart is the break below prior support zones. Levels that previously acted as stabilization areas in earlier cycles no longer hold. Instead of forming a base, price continues to move lower with no visible higher lows or reversal structure forming. The pattern across the full timeframe is consistent:
- Lower highs since the 2012 peak
- A failed recovery into 2021-2022
- A sharp decline post-2022 pushing to new lows
- No confirmed base or stabilization zone at current levels
Diamond Repricing Still in Motion
The chart does not yet show signs of stabilization. Unlike previous cycles where declines were followed by sideways movement, the current trend remains directional. This reflects a market still undergoing repricing rather than one that has found equilibrium.
Price continues to explore lower levels with no confirmed base or reversal structure. The combination of a decade-long pattern of lower highs, a failed 2022 recovery, and an accelerating post-peak decline without consolidation suggests that the diamond market is in a sustained downtrend - with the recent collapse marking a continuation rather than a conclusion.
 Marina Lyubimova


