Marina Lyubimova

Tesla continues to trade under firm bearish control, with price action reflecting a structured decline following a key rejection at higher levels. As $Trader noted, the path of least resistance continues to point lower until a clear pivot forms.
The TSLA Rejection That Marked the Shift
The turning point came with a dark cloud cover pattern - a clear rejection at higher levels that marked the transition from upward movement into a sustained decline. Following that signal, TSLA entered a descending channel, with price consistently forming lower highs and lower lows. This structure reflects controlled bearish pressure rather than sharp, erratic selling.
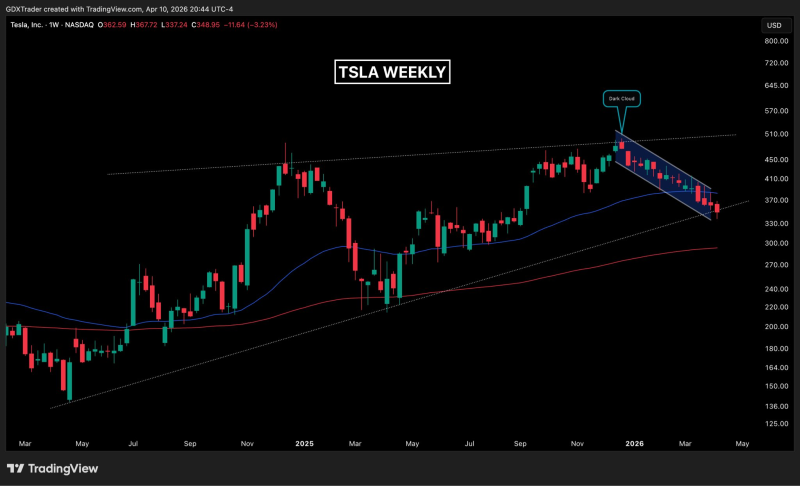
TSLA Slides Below 200DMA as Bearish Trend Deepens captured the structural deterioration as it accelerated, showing how the loss of the 200-day moving average removed a key support layer that had previously been containing the decline.
A TSLA Channel That Defines the Trend
The chart is dominated by a downward-sloping channel that continues to contain price action. Each rally attempt has been capped within this structure, reinforcing resistance at progressively lower levels. At the same time, price has not shown strong reactions at support - indicating that buyers are not stepping in with conviction.
TSLA Stock Stays in Correction Below $418.86 Resistance showed how the inability to reclaim $418.86 set the structural ceiling that the descending channel has been operating beneath ever since - making that level the reference point for where the trend would need to reverse to change character.
TSLA Breakdown Pressure Continues to Build
Recent price action shows TSLA attempting to break an ascending support within the broader downtrend. The latest bearish continuation signal adds weight to the downside case. The structure remains consistent with continuation across every key indicator:
- Lower highs remain intact
- Price is testing support within the channel
- Bearish candles continue to form near key areas
Tesla Price Analysis: Key $507 Resistance and $387 Support Ahead of Wednesday Earnings maps the longer-term support and resistance levels that define the range TSLA is working through - showing where price would need to interact with structure for either a continuation or a reversal scenario to develop.
 Marina Lyubimova