 Peter Smith

Tesla is under pressure, sliding toward the $392 level that could make or break a multi-week diamond formation on the weekly chart. At around $402.51, the stock is already down over 2% on the session, and the technicals are not painting a pretty picture. Overnight weakness could push TSLA toward support zones at $386, $374, $366, or even $357-$352 if the current level gives way.
The Diamond Setup: $480 Highs to a Pattern Under Pressure
The weekly chart tells a familiar story for TSLA watchers. After pushing toward highs near the $480-$500 range, the stock has carved out a classic diamond pattern, where price swings broaden and then contract into a tightening wedge. That post-peak drift into lower highs and higher lows is exactly what shapes this formation. Right now, TSLA's diamond structure sits near the $421-$460 range, and the lower trendline is the line in the sand.
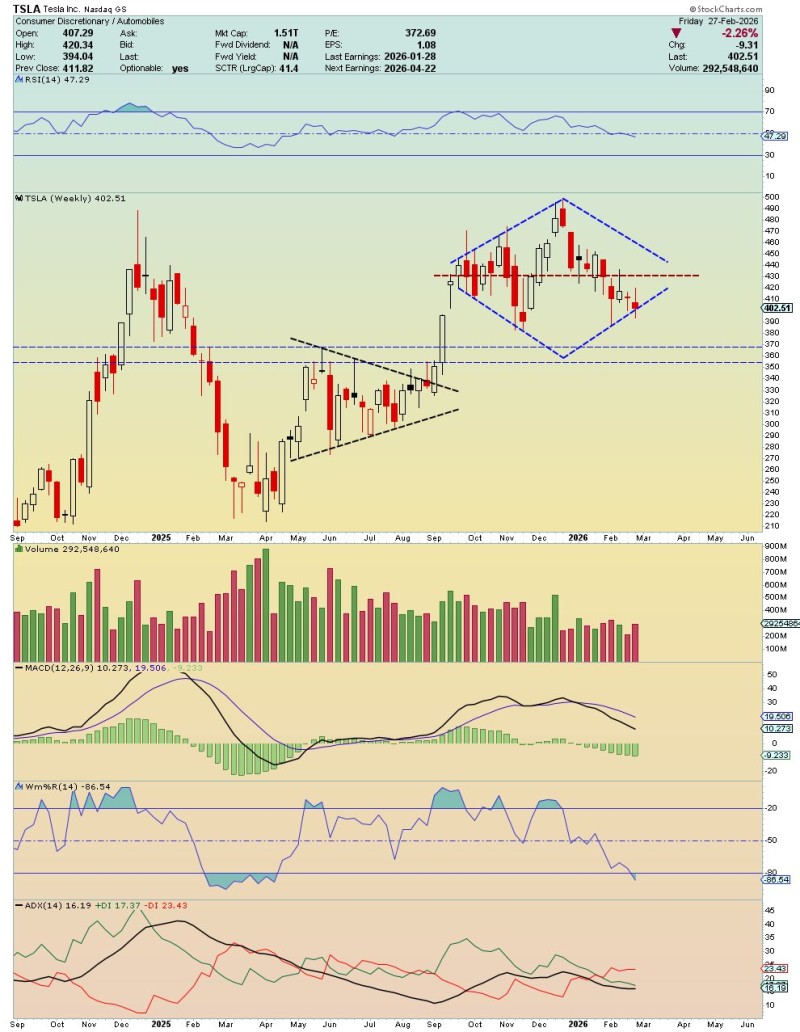
Break below $392, and the technical case for further selling gets harder to argue against. Recent commentary points to downside targets near $355-$366 as the next meaningful zone should the pattern fail to hold, with a potential bounce reaction after that.
RSI, MACD, and Volume All Tell the Same Story
The supporting indicators are not doing the bulls any favors. Weekly RSI has slipped below neutral, signaling diminished momentum. MACD shows a bearish crossover with contracting histogram bars, and volume has pulled back from earlier highs, suggesting conviction on the buy side is fading. Bulls trying to defend the lower boundary of the diamond are doing so with noticeably less firepower than before.
How $392 behaves from here is the key question. Hold it, and TSLA may simply grind sideways inside the broader consolidation. Lose it, and the door opens to a deeper corrective move toward those lower technical targets. Sector rotation trends and broader market sentiment will likely shape which way this resolves, but the chart is clearly tilted toward caution right now.
 Peter Smith


