 Alex Dudov

⬤ Tesla stock broke down from a diamond formation on the weekly timeframe and is now heading lower. The technical setup suggests a move toward the $355–$366 area. Price got rejected near the top of the consolidation range, which flipped the short-term momentum downward.
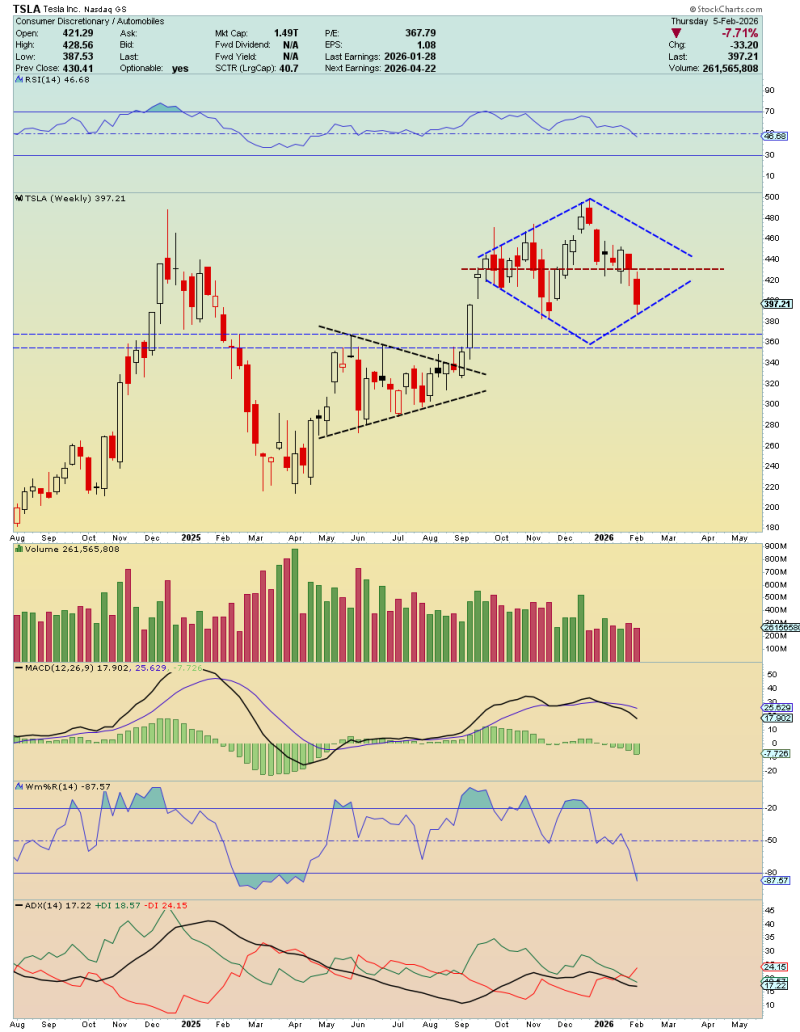
⬤ The weekly chart shows a clean diamond pattern that's now complete, with price dropping away from the upper boundary. TSLA is tracking toward the projected downside zone—a target that comes directly from measuring the breakdown structure.
⬤ Once price hits the $355–$366 support region, the setup calls for a bounce back up toward $386–$392. That zone lines up with an earlier trading area inside the broader range and marks where the recovery move could land after the initial decline plays out.
⬤ This TSLA price action shows how pattern breakdowns can map out both downside targets and likely bounce zones. What happens when price reaches that lower support range will tell us whether it holds and sets up for that move back toward the $386–$392 area.
 Alex Dudov


