 Marina Lyubimova

⬤ Tesla's weekly chart reveals a diamond-shaped consolidation forming right before the earnings announcement. Price action has been tightening between clearly marked support and resistance zones after a choppy rally. Charts show TSLA trading near the middle of this formation rather than breaking out in either direction. This pattern typically shows up after big moves when traders are trying to figure out their next play.
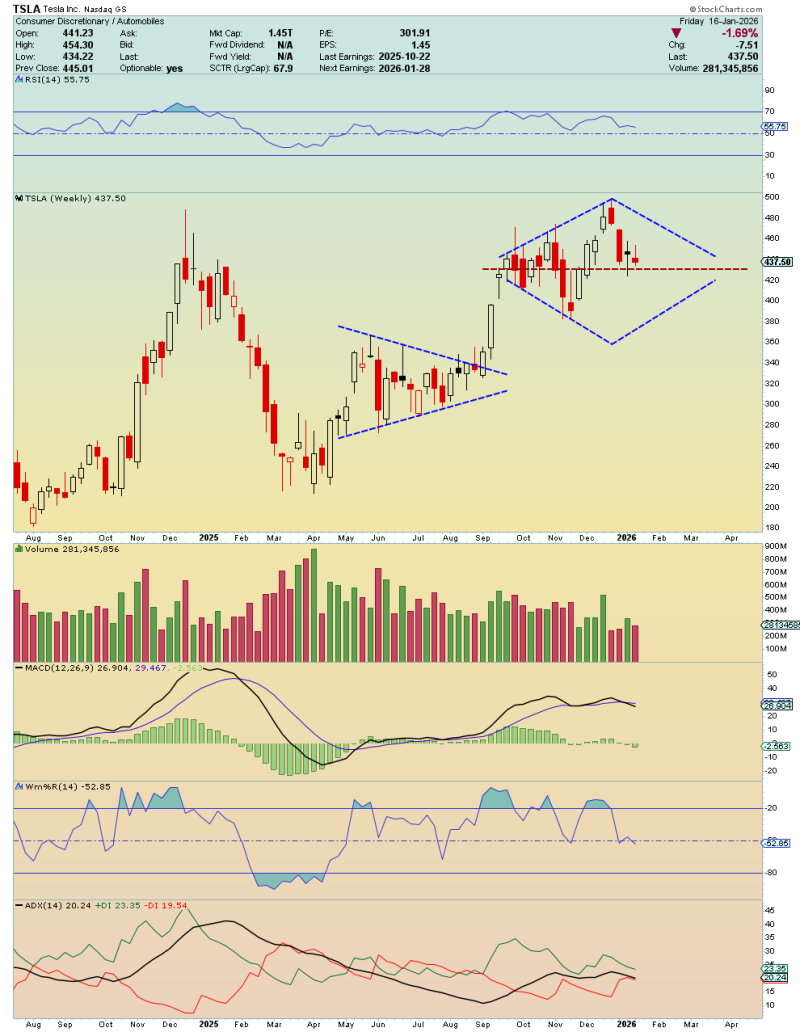
⬤ The weekly view shows Tesla bouncing between roughly $421 and $460, with highs and lows squeezing together into that diamond shape. Upside resistance sits between $466 and $472, matching previous weekly peaks where price stalled before. Momentum indicators like RSI hovering in the mid-50s and a flattening MACD suggest the stock is hanging in neutral territory without showing exhaustion signals.
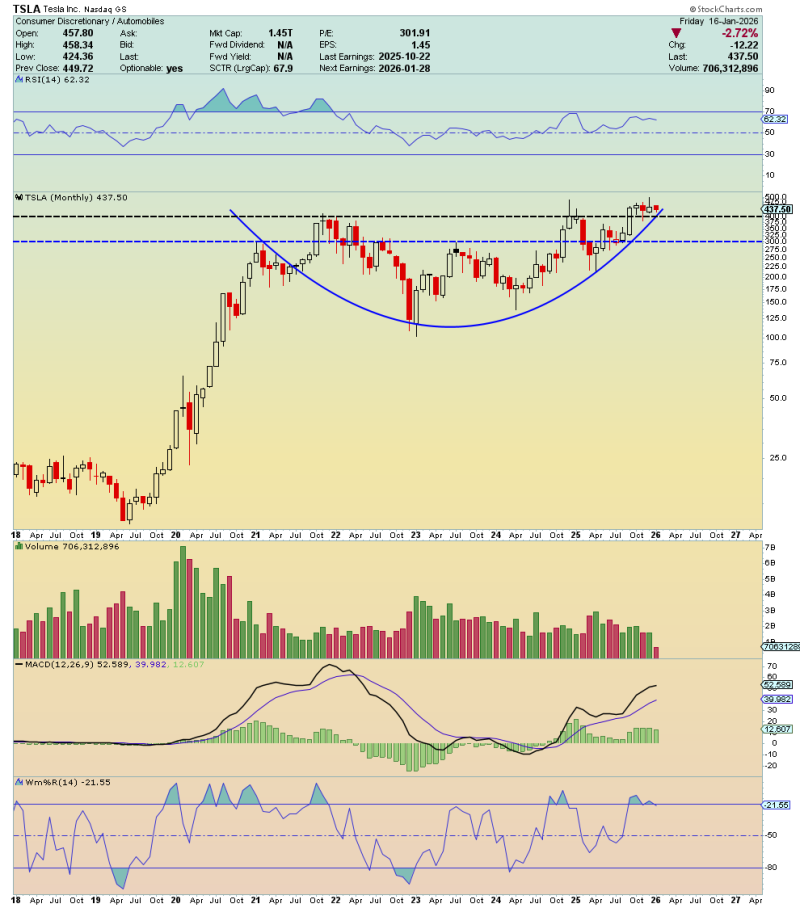
⬤ The monthly chart adds perspective, showing Tesla still grinding through a multi-year structure following its earlier surge. The rounded formation suggests any move higher will probably involve more back-and-forth rather than a straight shot up. Support levels include $421, $427, and $432, while resistance stacks up at $446, $452, $466, and $472—zones that have repeatedly influenced price behavior. Volume stays elevated but steady, showing active participation without panic or speculative frenzy.
⬤ This setup matters beyond Tesla itself given the stock's weight in major indices and the growth sector. How TSLA moves around earnings often sets the tone for tech and consumer stocks in the short term. A controlled climb toward upper resistance would support the consolidation story, while breaking below support could add selling pressure as broader markets wobble. With Tesla sitting at a technical crossroads, how this diamond resolves will likely shape expectations across risk assets in the near term.
 Marina Lyubimova


