Saad Ullah

⬤Tesla is hitting a decisive point on its long-term chart. Price has been compressing inside a multi-year ascending triangle for nearly two years, and the stock is now testing the 50-week moving average, which is acting as immediate support. Higher lows keep stacking up while a horizontal resistance zone near recent highs caps the upside, creating the classic coiled-spring setup.
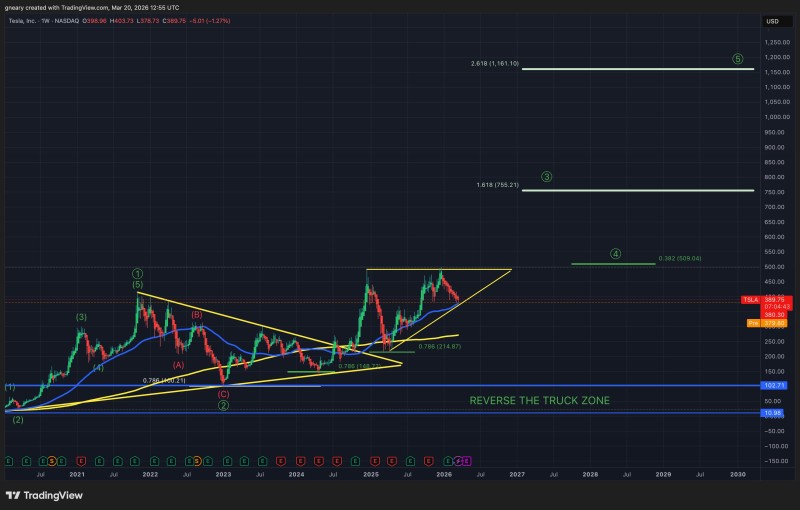
⬤Current price action keeps TSLA pinned in the $380-$390 range, right where Tesla tests $383 support with $410 as the next key break level. Fibonacci retracements and wave structures reinforce this zone. If the 50-week MA cracks, the next line of defense sits near the 200-week moving average around $270, a level that has held as a long-term base in previous downturns.
⬤The broader picture shows tightening volatility across multiple timeframes. In a parallel setup, TSLA consolidates between $383 support and a $440 resistance shelf, with market participants waiting for directional confirmation before committing. This range compression historically precedes explosive moves in either direction.
⬤Adding to the tension, TSLA's triangle tightens near $395 as a Bollinger Band squeeze signals a big move ahead. Triangle formations and Bollinger Band contractions are converging simultaneously, which compresses potential energy further. Once this range resolves, the breakout, or breakdown, could carry meaningful momentum for TSLA and the broader tech sector.
 Saad Ullah