 Saad Ullah
⬤ Shares of SoFi Technologies turned heads by finishing in positive territory on a broad red day in the market. Trading near $18.61 on the weekly chart, the stock held above a visible demand zone around the $17-$18 range despite widespread selling pressure. For traders watching relative strength signals, a stock that stays green when everything else is bleeding tends to mean something.
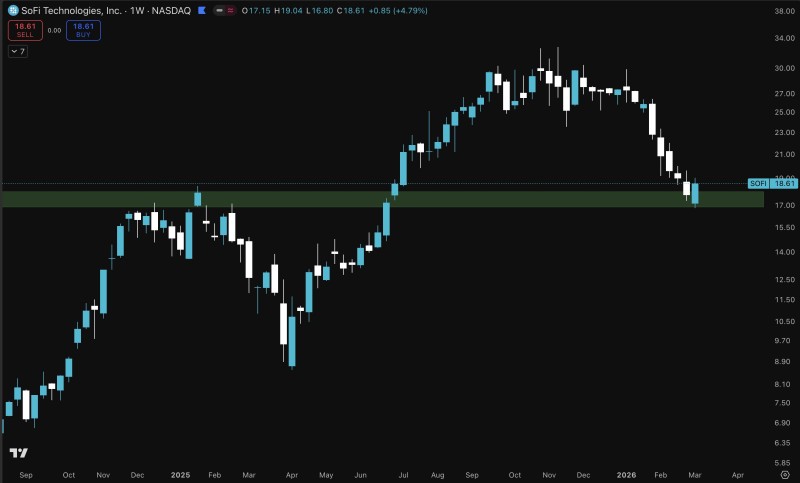
⬤ SOFI had pulled back sharply from its late-2025 highs near $30, and price action over recent weeks shows the stock stabilizing in a zone where buyers previously stepped in. A key Fibonacci support zone near the $18 level aligns with prior consolidation areas, making it a critical technical checkpoint for the current structure and near-term momentum.
⬤ Fundamental tailwinds have helped keep longer-term interest alive in the name. SoFi reaching a $1 billion revenue milestone while adding over one million new members underscores a growth story that still resonates. Expanding lending, banking, and financial services products continue to build out the company's ecosystem, giving bulls a narrative to hold onto during the pullback.
⬤ Looking further out, some technical analysts are eyeing a potential larger bullish pattern forming on the SOFI chart if current support levels continue to hold. With markets remaining volatile, the stock's ability to maintain relative strength could keep it on traders' watchlists in the sessions ahead. Whether the demand zone holds under further pressure remains the key question.
 Saad Ullah


