 Marina Lyubimova

⬤ SoFi Technologies (SOFI) is sitting at a fascinating technical crossroads right now. The stock is forming two bullish triangles—a pattern that's been incredibly reliable for SOFI in the past. When we've seen this setup before, it wasn't just a small bump—we're talking about explosive moves of +212% and +152%. That's the kind of performance that gets traders paying attention, and right now, all eyes are on whether history's about to repeat itself.
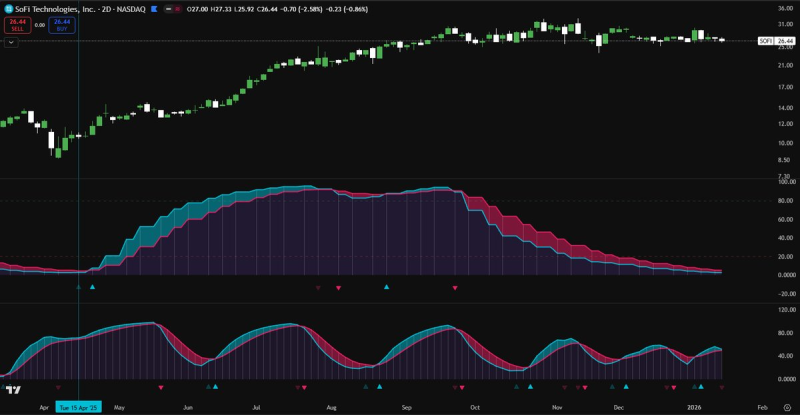
⬤ What makes this particularly interesting is the slow stochastic indicator creeping toward a crossover. For those who follow technical analysis, this is often the spark that lights the fuse. When you combine tightening triangle patterns with momentum indicators starting to flip, you've got a recipe for something big. The stock's coiling up inside these bullish formations, and the pressure's building for a potential breakout that could mirror those impressive historical runs.
⬤ Here's the thing—when multiple technical signals line up like this, markets tend to listen. We've got the triangle patterns doing their thing, the stochastic getting ready to flip, and early signs of strength already showing in the price action. If this setup confirms, SOFI could be gearing up for a serious move higher. It's not guaranteed, but the blueprint's there from previous rallies.
⬤ The potential here is clear: if momentum continues building and that stochastic crossover materializes, SOFI could be in for substantial gains. Traders are watching closely because when stocks break out of these consolidation patterns with strong technical backing, the moves can be dramatic. Whether this becomes the next +150% rally or something more modest, the setup has definitely caught the market's attention and could drive significant trading volume in the coming sessions.
 Marina Lyubimova


