 Saad Ullah
⬤ Oracle has broken below its 200-day moving average, signaling a noticeable deterioration in its medium-term trend. The chart shows ORCL falling to around $198 after a persistent multi-week decline from the $345.72 high reached earlier this year. The move beneath the long-term average, currently sitting near $210, underscores weakening momentum as selling pressure picks up across recent sessions.
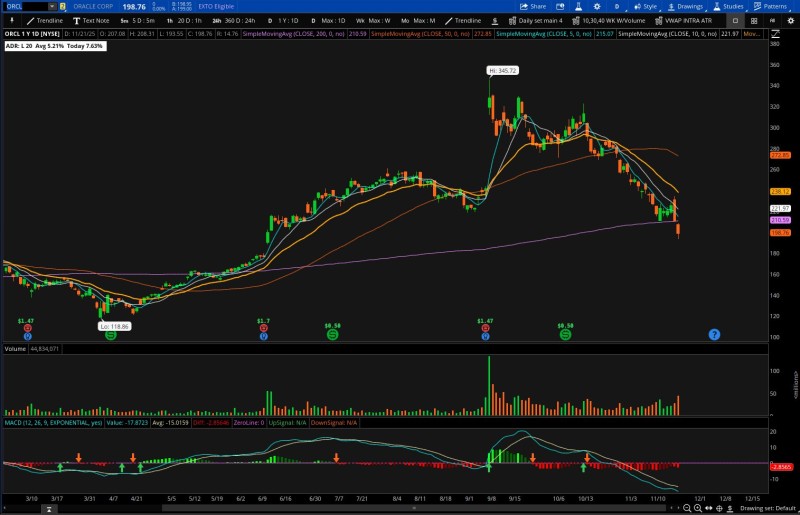
⬤ The chart highlights how Oracle's price broke down through multiple short-term moving averages before sliding below the 200-day line. Volume ramped up during the decline, and the MACD stayed deeply negative, showing sustained bearish momentum. This is a stark contrast to Oracle's multi-month rally through mid-2025. As support zones gave way, the stock kept trending lower, forming a clear reversal pattern visible across recent daily candles.
⬤ Additional perspective comes from comparing Oracle's stock performance with changes in its credit default swaps. Oracle's CDS spreads have jumped to roughly 110, marking a steep rise in perceived credit risk. Meanwhile, the stock has rolled over from its highs and moved back toward levels closer to the long-term trend line. The widening CDS spread moving opposite the stock price signals heightened concern about leverage-related pressures. The combined movement across credit and equity markets shows a notable shift in sentiment regarding the company's financial health.
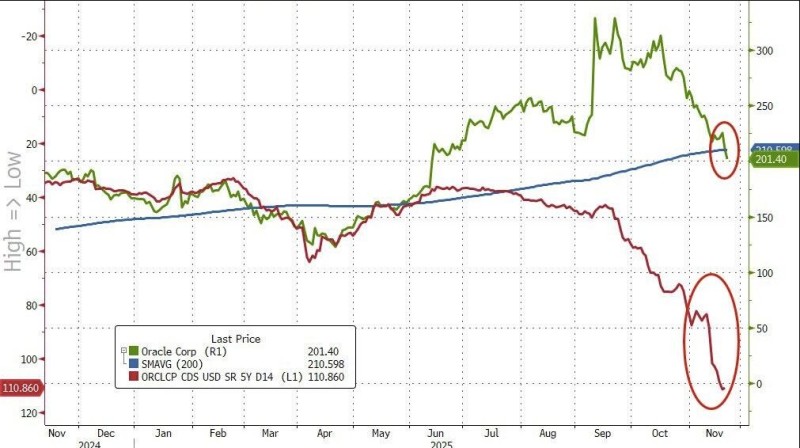
⬤ This matters because simultaneous weakness in Oracle's stock and widening credit spreads point to a broader reassessment of risk. When equity momentum breaks down while credit stress accelerates, it often suggests shifting expectations about balance sheet strength and leverage exposure. How Oracle responds in the coming weeks could influence perceptions across similarly structured large-cap tech companies.
 Saad Ullah


