 Marina Lyubimova

⬤ Oracle shares kept sliding on the daily chart, with ORCL now hovering around $222.85 as the losing streak continues. The stock has dropped below short-term moving averages and is testing long-term trend support marked by the red line on the chart. A fresh LEAF report and AI forecast were released to map out how ORCL might behave after this recent pullback.
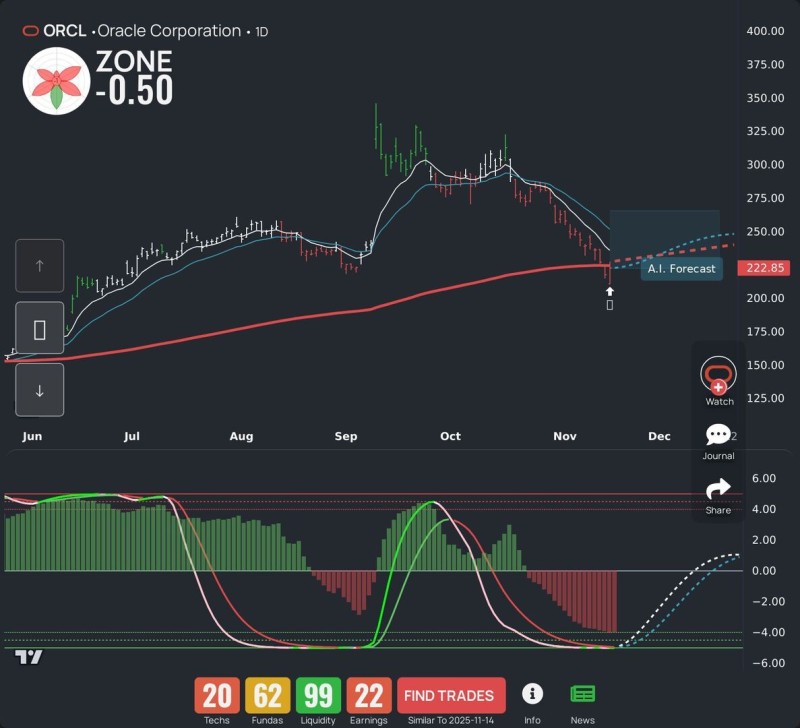
⬤ The chart shows a clear downward move that started in September after Oracle lost steam from its mid-year highs. Short and intermediate trend measures have flipped negative, while the long-term trend line sits right below current prices. An AI forecast zone suggests a potential bottom forming near these levels, with dotted lines pointing to a gradual slowdown in the decline if the stock can hold here. Momentum indicators at the bottom show red histogram bars and downward-curling oscillators, though there's a hint of an early bounce from oversold territory.
⬤ Oracle's strong summer rally—which pushed shares above $300—has completely reversed into a pattern of lower highs and lower lows. Throughout October and November, selling pressure built as the stock slid steadily down while liquidity stayed strong but technicals weakened. The dashboard shows mixed signals: soft technical factors, moderate fundamental strength, elevated liquidity scores, and weaker earnings metrics. It's a snapshot of the near-term shift the AI model is trying to interpret.
⬤ ORCL's test of long-term support matters because these levels often shape sentiment during extended selloffs. When a major tech stock hits a structural trend line while AI models flag potential stabilization, it can shift expectations about whether the drop continues or starts to level off. Right now, Oracle's price action fits into a broader cycle of momentum shifts across large-cap tech during a period of market adjustment.
 Marina Lyubimova


