 Eseandre Mordi

The technical structure is textbook—one of those patterns that jumps off the chart when you zoom out to the weekly timeframe. The formation took months to develop, and now all three key components are in place. The left shoulder formed as a moderate peak in mid-2025, followed by a sharp rally toward the $330–$350 region marking the cycle high as the head. The right shoulder then developed as a lower swing high with weakening bullish momentum.
The stock is now testing the $215–$220 support zone—the neckline of this pattern. ORCL currently trades near $219.86, sitting directly on this critical level.
If price closes below this zone, the chart suggests a move into a low-volume area where liquidity thins considerably. This lack of historical trading activity below $210 could accelerate any downward move.
Volume Profile and Momentum Paint a Bearish Picture
Several indicators support the downside case. Candles are clustering tightly along the neckline, showing pressure building—markets often resolve these compressions with strong directional movement. The declining volume bars confirm diminishing buyer conviction as the pattern matured, especially on the right shoulder.
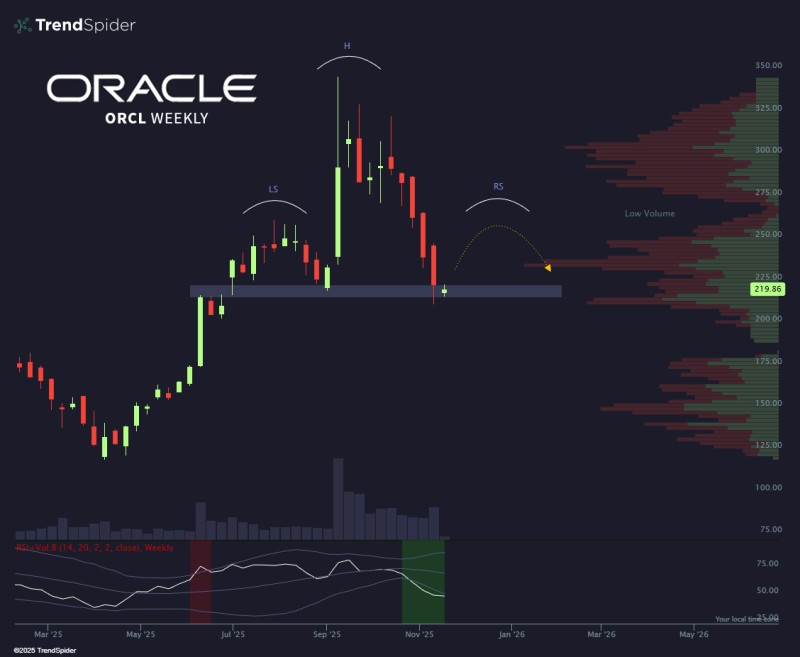
The RSI indicator is trending lower, showing continued weakening momentum—not yet oversold, but firmly under distribution pressure. The volume-at-price histogram shows a major liquidity gap beneath current levels, meaning if the neckline fails, the next meaningful demand zone appears much lower. These technical elements collectively reinforce the risk scenario traders are discussing.
What's Driving the Technical Weakness
Though Oracle remains a major player in cloud infrastructure and enterprise software, several factors may be undermining sentiment. The company faces intensifying competition in AI and cloud services, especially from Microsoft Azure, Amazon AWS, and Google Cloud. Macro uncertainty and high interest rates are pressuring valuations across large-cap tech, while slower enterprise spending cycles—particularly in hardware-heavy modernization projects—are weighing on growth expectations. Reduced investor appetite for high-multiple cloud stocks following several quarters of sector volatility has also contributed to the selling pressure. Together, these forces may be amplifying the bearish technical signals on ORCL's chart.
Oracle Approaches a Critical $215-$220 Decision Point
The coming weeks will be pivotal for Oracle:
- If the $215–$220 support holds, ORCL could rebound toward the $245–$250 range.
- If the support fails, a deeper selloff becomes likely, matching the max pain scenario outlined in the chart.
For now, traders are watching this neckline closely. A decisive move above or below it will define Oracle's trend heading into early 2026.
 Eseandre Mordi


