Peter Smith

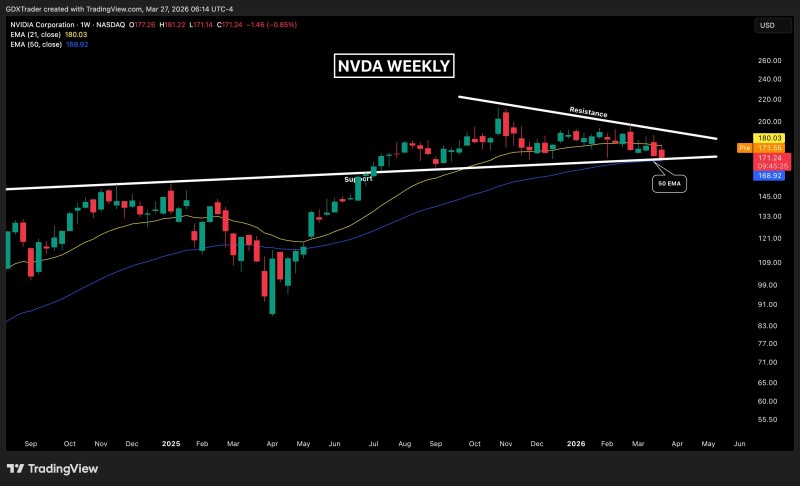
NVIDIA is approaching a critical technical inflection point as price tightens within a symmetrical triangle on the weekly chart. The structure shows compression nearing resolution, with price pressing into support and the balance beginning to tilt toward a potential breakdown.
The Compression Nearing Resolution
The chart shared by @GDXTrader shows NVDA trading within a well-defined symmetrical triangle, formed by descending resistance and rising support. Price has respected both boundaries over multiple months, forming lower highs beneath resistance and higher lows above support - a classic compression phase where volatility contracts ahead of a larger move.
This type of structure has been observed recently in NVDA as well, where tightening ranges signaled an upcoming breakout phase, the analyst notes, as covered in NVDA stock analysis signals major move as bands tighten.
NVDA Price Presses Into 50 EMA Support
Recent price action shows a clear shift in behavior. NVDA is now pressing into the lower boundary of the triangle, which aligns with the 50 EMA - making this level a key technical pivot. The current weekly candle is developing bearishly, consistent with the analyst's observation of a potential continuation move. Importantly, price is not bouncing strongly from support, suggesting weakening demand.
- Lower highs forming beneath resistance
- Higher lows compressing above support
- 50 EMA aligning with triangle's lower boundary
- Weekly candle developing bearish character
- Demand weakening as price fails to bounce
This aligns with broader NVDA technical trends where consolidation near key moving averages has defined recent price action, including ranges around $170-$185 highlighted in NVDA stock consolidation before the next move.
Why the Lower Triangle Boundary Is the Inflection Point
The lower boundary of the triangle represents the final structural support holding the pattern intact. A confirmed breakdown below this level would shift the setup from neutral compression into bearish continuation. At the same time, resistance remains firmly in place above, limiting upside potential - creating an imbalance where downside risk is increasing as price compresses toward support.
Recent analysis also points to downside scenarios if support fails, including projections toward lower levels in corrective structures,"the analyst warns, as outlined in Nvidia correction may extend toward $161.
The NVDA Signal Traders Are Watching Now
NVDA is at a decisive moment where structure outweighs momentum. The triangle is nearing resolution, and price is testing support rather than resistance - a subtle but critical shift. A breakdown below the triangle and the 50 EMA would likely trigger a deeper retracement and confirm that sellers are gaining control. Holding this level, on the other hand, could extend consolidation, though price would remain trapped within the pattern.
For now, NVDA remains in compression - but with pressure building at support, the balance is beginning to tilt toward a potential breakdown.
 Peter Smith