 Eseandre Mordi

⬤ Nvidia shares slipped lower in recent trading, extending a shaky technical pattern that's got traders watching closely. The stock couldn't hold above $182.6—a level that's become increasingly important for keeping the bulls in control. If NVDA closes below this mark, it opens the door to deeper losses ahead.
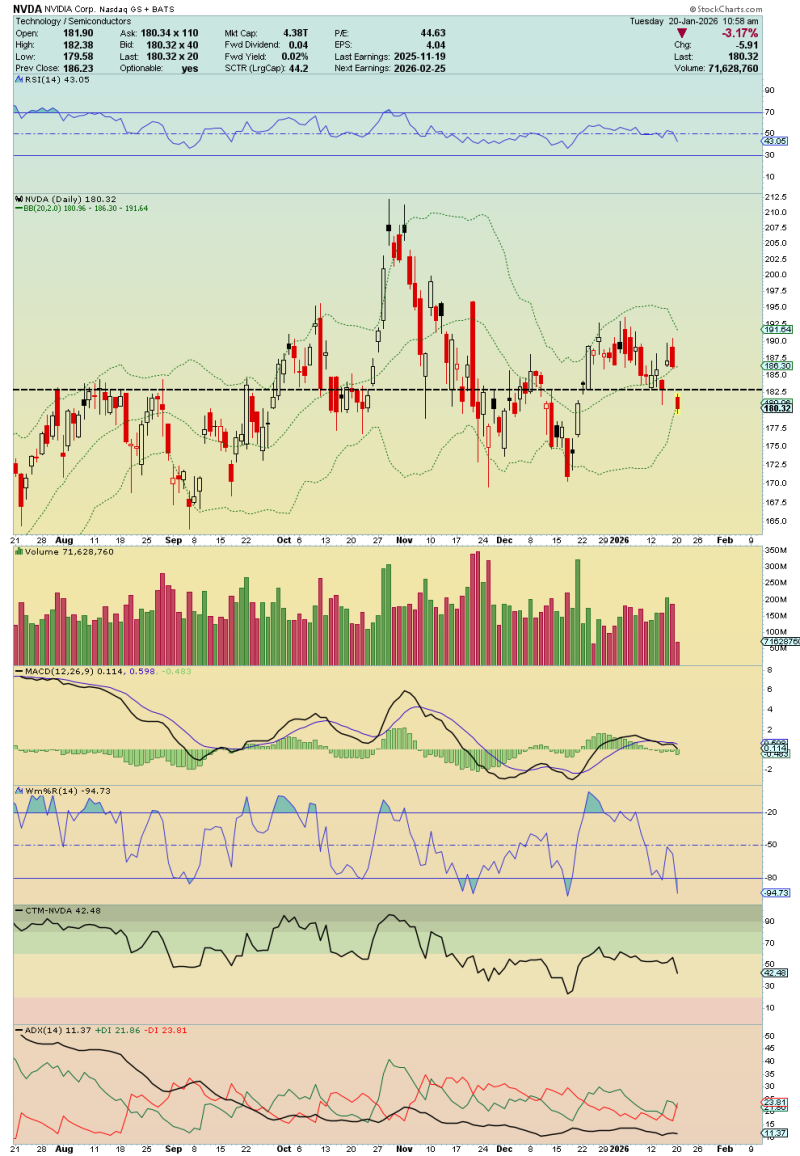
⬤ Right now, the stock's hovering around $180 after getting rejected multiple times when trying to push higher. The Bollinger Bands on the daily chart are starting to tighten up around the midline, which typically means a bigger move is coming. If Nvidia can't climb back above $182.6 soon, those bands could start expanding downward—a pattern that usually means more selling pressure is on the way.
A sustained failure to reclaim $182.6 could cause the lower Bollinger Band to expand and slope downward, a development that often coincides with trend continuation to the downside.
⬤ The technical setup is pointing toward a potential slide to the $166-$167 area if volatility picks up. The momentum indicators aren't looking great either. The RSI is sitting in the low-40s, showing weakening bullish energy without being oversold yet. MACD remains flat, suggesting there's not much buying enthusiasm, and volume shows traders aren't exactly rushing in to scoop up shares at these levels.
⬤ This matters beyond just Nvidia. As one of the biggest semiconductor stocks and a major driver of tech indices, a drop into the mid-$160s would signal a meaningful pullback and could drag down sentiment across the entire sector. On the flip side, if NVDA can push back above $182.6 and hold it, the immediate risk fades and the chart stabilizes. Either way, this price zone is critical to watch over the next few sessions.
 Eseandre Mordi


