 Victoria Bazir

⬤ IREN Limited took a hit after price action stalled at a major technical resistance zone. The stock got rejected twice near the Gaussian moving average, which triggered roughly a 7% drop.
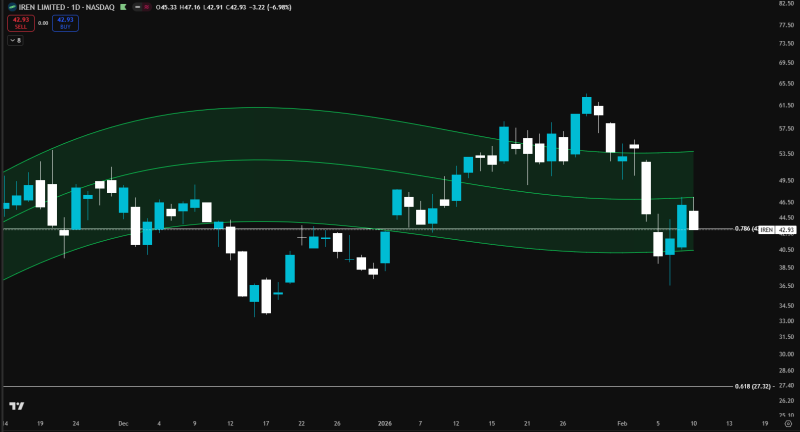
⬤ The chart shows IREN trading around the $42–$43 zone after previously testing higher levels near the mid-$50 range. Multiple candles stalled at the upper resistance band before flipping downward. The rejection signals that selling pressure kicks in whenever price approaches the upper channel, similar to what we've seen before with IREN rejection at resistance zones.
⬤ The pullback came after a recovery phase where the stock climbed into resistance but couldn't keep the momentum going. This reaction looks a lot like earlier technical patterns where price pulled back after testing key levels—like when it was holding support near $40-$50 ranges and eyeing a $96 upside target after consolidation.
⬤ When you see repeated rejection at major indicators, it usually means the market's not sure which way to go. The current IREN movement shows how price behavior near trend indicators shapes short-term sentiment and can trigger quick downside moves when buyers can't reclaim resistance.
 Victoria Bazir


