 Usman Salis

⬤ Bitcoin broke under the $67,000 level after a brutal six-hour stretch that wiped out nearly $3,000 in value. Coin Bureau flagged the move, pointing out how sell pressure ramped up fast on the hourly chart.
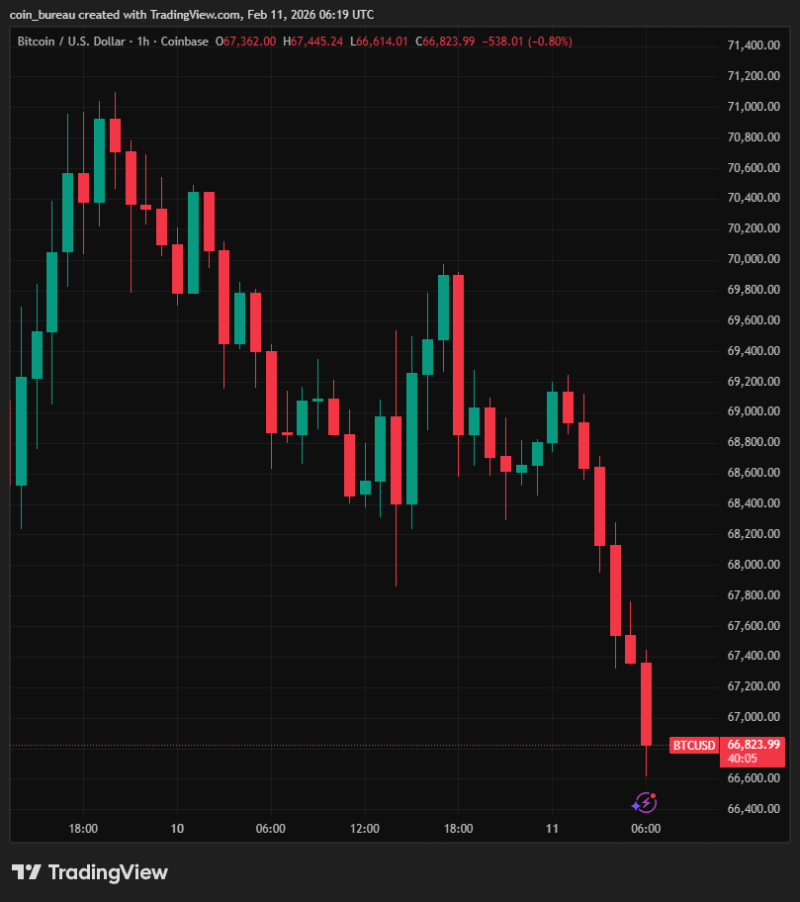
⬤ The TradingView chart tells the story pretty clearly—BTC was hanging out near the top of its intraday range when things suddenly flipped. A string of fat red candles hammered price down to around 66,823, confirming the break below 67,000 wasn't just a fake-out but a real directional shift. This kind of quick drop mirrors what we've seen in other sharp market sell-offs, where volatility kicks into high gear once the momentum turns.
The acceleration in sell pressure on the hourly chart coincided with the failure of brief rebounds to hold support. As Coin Bureau noted in their analysis
⬤ Before the plunge, BTC was stuck in choppy trading where every bounce fizzled out fast. Once support cracked, the downside really picked up steam, pushing BTC into the mid-66,000s with a steeper intraday slide. We've seen similar breakdowns before when trendline support breaks and when Bitcoin approaches what traders consider critical support zones—momentum shifts tend to make intraday moves way more dramatic.
⬤ These rapid drops matter because they mess with short-term positioning and crank up volatility expectations across the whole crypto market, especially when big round-number levels like 67,000 give way. The latest move shows just how fast sentiment can flip during range-bound trading and how vulnerable BTC is to sudden bursts of selling pressure in a single session.
 Usman Salis


