 Saad Ullah

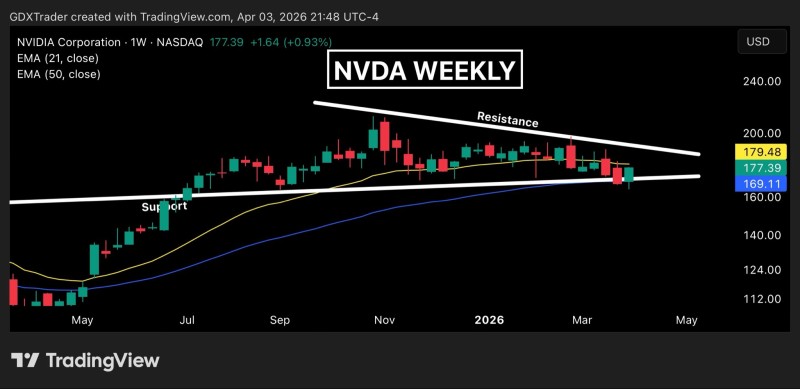
NVIDIA stock is approaching a decisive moment as price compresses within a symmetrical triangle and reacts directly off rising support. According to analysis shared by $Trader, NVDA is trading inside a symmetrical triangle defined by lower highs and higher lows - a tightening structure that reflects a balance between supply and demand, with neither side in clear control. The latest weekly candle shows buyers stepping in at a key confluence zone, but the broader structure remains unresolved, keeping the setup firmly in consolidation territory.
Compression is building inside the triangle - descending resistance caps every rally while ascending support keeps lifting the floor, and the range is getting tighter with each candle.
On the chart, descending resistance continues to cap upside, while ascending support lifts price from below. The result is a narrowing range where volatility is compressing - a typical precursor to a larger directional move.
NVDA Buyers Defend Key Confluence Zone
The most recent weekly candle formed precisely at ascending support, which also aligns with the 50 EMA - adding meaningful technical confluence to the level.
This reaction reflects demand stepping in after a controlled pullback:
- Price respected the rising trendline
- The 50 EMA acted as dynamic support
- The bounce occurred without breaking structure
This type of behavior aligns with broader technical patterns seen in recent NVDA price consolidation around $170, where the stock has remained range-bound before expansion phases. The bounce looks constructive, but the move remains measured rather than impulsive - suggesting accumulation may be present, though not yet dominant.
NVDA Structure Stays Neutral Inside the Triangle
Despite the supportive bounce, NVDA is still trading within consolidation. The sequence of lower highs continues to limit upside, while higher lows prevent breakdown - creating a tightening equilibrium.
Price action inside the triangle tends to be choppy, with both sides reacting at boundaries rather than driving sustained moves. This makes conditions favorable for patience over aggressive positioning.
Structure inside the triangle is neutral - lower highs cap every push higher while higher lows absorb every dip. No side has control yet, and that's exactly the point.
The setup is consistent with NVDA volatility compression signals that have preceded larger moves in prior cycles.
NVDA Breakout Will Define the Next Trend
The defining signal remains a breakout from the triangle. According to the structure:
- A move above descending resistance would invalidate the pattern of lower highs
- A breakdown below ascending support would disrupt the higher-low structure
Until one of these levels is decisively breached, NVDA remains in a compression phase where volatility is building but not yet released. This aligns with broader technical setups where tightening ranges precede expansion - particularly as price approaches the apex of the pattern. Traders watching NVDA targets $200 after technical rebound scenarios will need to see resistance cleared before that narrative gains traction.
The chart reflects a market coiling rather than trending. Buyers are active at support, but control remains unclaimed - leaving NVDA in a waiting game where the next move will come not from within the range, but from its resolution.
 Saad Ullah


