Artem Voloskovets

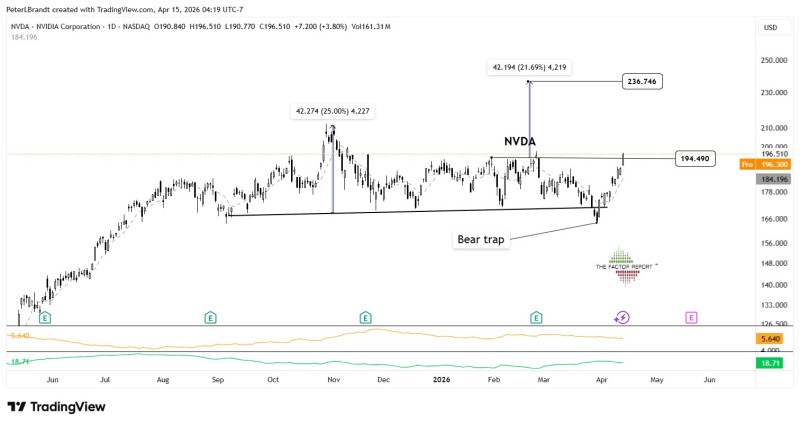
NVDA) is no longer trading like a stock stuck in a topping pattern. The chart shows an eight-month head-and-shoulders structure that briefly completed around March 30, but the breakdown failed almost immediately. Instead of follow-through to the downside, price snapped back above the broken area and rallied toward the upper end of the range. As The Factor Report notes, that type of failure is often the real signal: what looked bearish turned into a bear trap.
NVDA Pattern Failed When Price Refused to Stay Broken
The key feature on the chart is not the head-and-shoulders top itself, but the market's inability to extend lower after the neckline break. That brief move below support was quickly reversed, which invalidated the bearish pattern and trapped sellers leaning on a breakdown.
Failed patterns can matter more than completed ones. Once price reclaimed the lost ground, the structure changed from a potential top into a reversal setup.
The chart even marks that March drop as a bear trap, reinforcing that the breakdown lacked confirmation.
Why the $194 Area Matters for NVDA First
Price has now pushed back toward the horizontal zone around $194.49, which is shown directly on the chart as the immediate overhead barrier. NVDA is trading just under that region after rebounding from the failed breakdown, so this level becomes the first technical test of whether the reversal has real continuation behind it.
That makes the current move important. A failed bearish pattern is one thing; pressing back into visible resistance is another. The chart suggests buyers have already regained control of the structure, but clearing the prior ceiling would further confirm that the bear trap has fully shifted momentum upward. Similar coverage has recently focused on NVDA reclaiming key averages and tightening beneath resistance, opening paths toward higher targets.
A failed bearish pattern is one thing - pressing back into visible resistance is another. Buyers have already regained control of the structure.
How the NVDA $236 Projection Is Derived
The upside target shown on the chart comes from measuring the height of the original head-and-shoulders formation and projecting that distance upward from the right shoulder high. In this case, that yields a target near $236.75, with $236 serving as an approximate objective.
That does not make the number fixed or guaranteed. It simply gives traders a measured-move framework for what a head-and-shoulders failure can produce when momentum reverses in the opposite direction. Comparable NVDA technical setups centered on breakout structures point to upside continuation targets in the $220-$230 area, which fits the broader idea of renewed expansion after consolidation.
The Strongest NVDA Signal May Be the Failure Itself
What stands out most is that NVDA did not confirm the bearish thesis when it had the chance. The stock broke support, failed to extend lower, reversed, and climbed back toward range highs. In pure technical analysis terms, that sequence often matters more than the original pattern label.
When a bearish structure fails that visibly, the next move often belongs to the other side.
For now, the chart remains centered on one message: the head-and-shoulders top did not deliver. When a bearish structure fails that visibly, the next move often belongs to the other side. Earlier analysis tracking Nvidia targeting $230 as chart highlights $167 support retest lines up with this picture of a stock reasserting its longer-term trend after a shakeout.
 Artem Voloskovets