 Artem Voloskovets

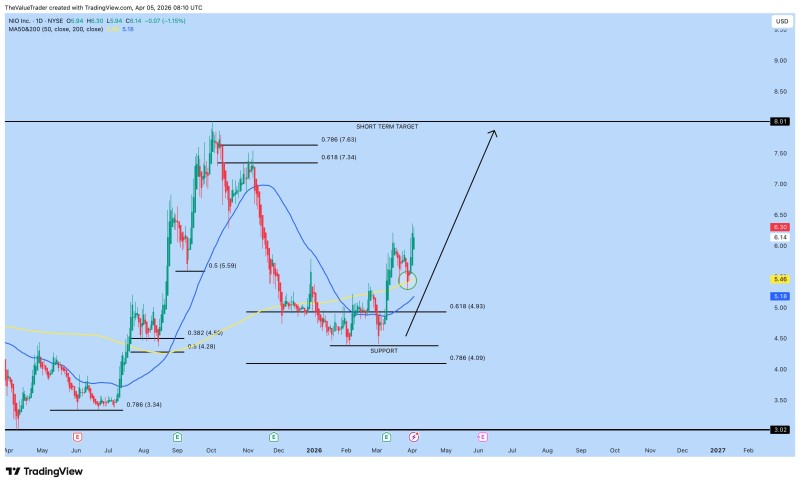
NIO is transitioning from a corrective phase into a potential recovery setup, with price rebounding from key support and holding above important technical zones. The Value Trader identifies $8 as the short-term target - a level aligned with resistance and Fibonacci projections visible on the chart.
The short-term target sits at $8 - a level that aligns with resistance and Fibonacci projections visible on the chart.
NIO stock forms a base around key Fibonacci support
The chart highlights a clear support structure between roughly $4.90 (0.618 Fibonacci) and $4.09 (0.786), where price stabilized after a prolonged decline. This aligns closely with broader NIO Stock Price Analysis: NIO Targets $8.20 as Weekly Base Forms, showing these zones acting as key support during pullbacks.
Following this base formation, NIO began printing higher lows, indicating a shift away from the previous downtrend. The ability to hold above these levels is central to maintaining the current recovery structure.
NIO momentum builds above moving averages
Price is now trading above both key moving averages shown on the chart, signaling improving momentum. This behavior is consistent with recent setups tracked in NIO Stock Jumps 24% in 63 Days, Eyes $7.50 Breakout, where NIO regained strength after reclaiming support and building a base above short-term averages.
The structure now reflects early-stage trend recovery rather than continuation of the prior decline. Each pullback has been relatively shallow, suggesting buyers are stepping in at higher levels.
Each pullback has been relatively shallow, suggesting buyers are stepping in at higher levels - a key sign that market control is shifting.
The zone that flipped from resistance to support
A critical level near $4.90-$5.00, marked on the chart, has shifted from resistance into support. This type of level flip is often a defining moment in technical analysis, signaling that market control is transitioning.
The chart visually highlights a reaction at this zone, confirming it as a pivot point. Holding above it keeps the structure intact and supports further upside attempts.
NIO stock path toward the $8 objective
The projected move toward $8 aligns with broader technical frameworks outlined in NIO Stock Analysis: $8.51 Target in Sight, where recovery structures point toward higher resistance zones between $7.50 and $8.50.
The chart's upward projection reflects a natural sequence rather than a single breakout move - patience at support defines the trade.
This creates a natural progression:
- Initial resistance near $7.30-$7.60 (Fibonacci levels shown on chart)
- Extension toward the $8 region as the short-term target
- Continuation dependent on holding above the reclaimed support zone
The chart's upward projection reflects this sequence rather than a single breakout move.
 Artem Voloskovets


