 Sergey Diakov

⬤ Microsoft's daily chart confirmed a death cross formation as shares extended their recent decline, with the 50-day moving average crossing below the 200-day moving average near the $483 level. This marks the first appearance of this signal since February and comes after a prolonged pullback rather than a sudden breakdown.
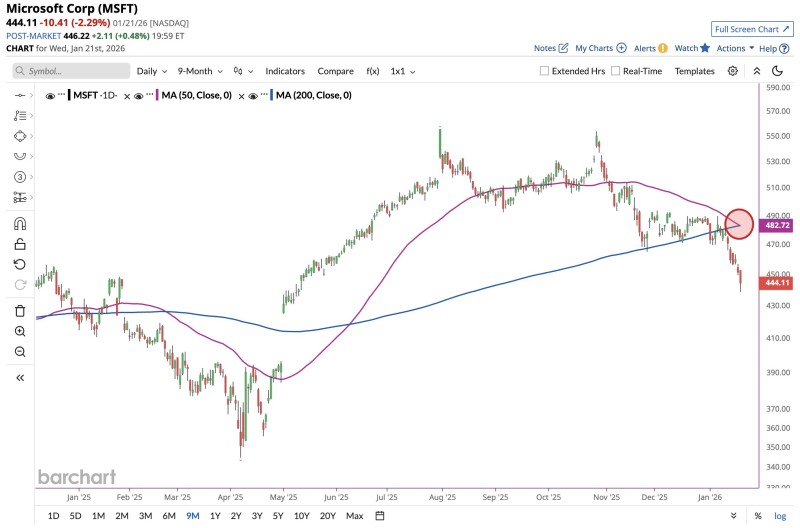
⬤ The technical crossover occurred after MSFT failed to reclaim the 200-day moving average, which previously served as support. Shares recently traded around $444, down significantly from their peak above $550 reached earlier in spring 2025. The stock has established a pattern of lower highs, indicating fading upside momentum.

⬤ This shift matters for market watchers because the death cross signals weakening medium- to long-term momentum in one of the market's most heavily weighted tech stocks. The previous death cross in February preceded a decline exceeding 13% over six weeks. Continued trading below key moving averages could drive increased volatility and influence broader technology sector sentiment in coming weeks.
 Sergey Diakov


