 Saad Ullah

⬤ Microsoft shares have slipped into weaker territory after breaking below the November low on the weekly chart. The bounce that came after November's drop didn't go very far and failed to create a solid intermediate-term floor. Without much follow-through from that rebound, it looks like the correction isn't over yet—it's still playing out.
⬤ The September low might have been just a midpoint rather than the final bottom. This means timing matters more than looking for an immediate turnaround. Based on historical patterns, a more significant low could still be coming, possibly during the last week of January. Recent trading backs this up since MSFT hasn't managed to reclaim the support levels it lost after breaking down in November.
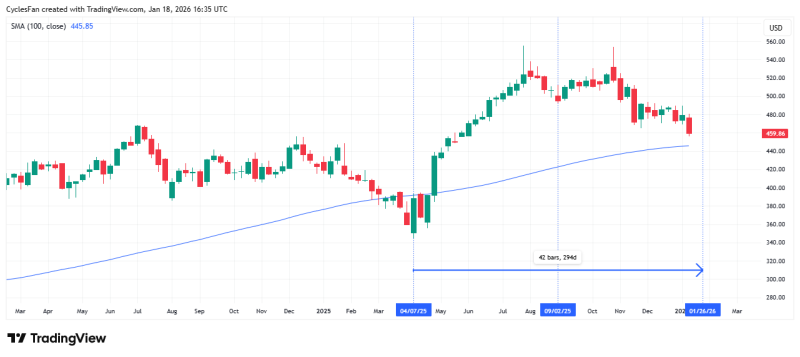
⬤ All eyes are now on the 100-week moving average hovering around $446. This long-term line represents the next major support zone worth watching. If Microsoft closes below this level on a weekly basis, it would confirm that the stock put in a major top back in late October instead of just hitting a temporary rough patch. Until we see how price reacts at this level, the downside risk remains the main concern.
⬤ This matters because when stocks break below intermediate lows and test long-term moving averages, it often signals bigger changes in market structure. For Microsoft, how the stock behaves around that $446 level will help show whether this decline turns into something deeper or stabilizes at long-term support. With late January marked as a potential turning point, the next few weekly closes could set the tone for where MSFT—and possibly the broader market—heads next.
 Saad Ullah


