Eseandre Mordi

Microsoft's long-standing uptrend has hit a critical inflection point. For the first time since 2013, MSFT has closed below its 200-week moving average - a level that has consistently defined its structural bull trend for over a decade. As Oliver | MMMT Wealth (CPA) noted, the move stands out not only technically, but also in how investors are reassessing positioning within large-cap tech.
The Breakdown That Resets MSFT's Long-Term Trend
The weekly chart reflects a decisive shift in structure. After years of respecting the 200-week moving average as dynamic support, price has now broken below it with a strong downside move.
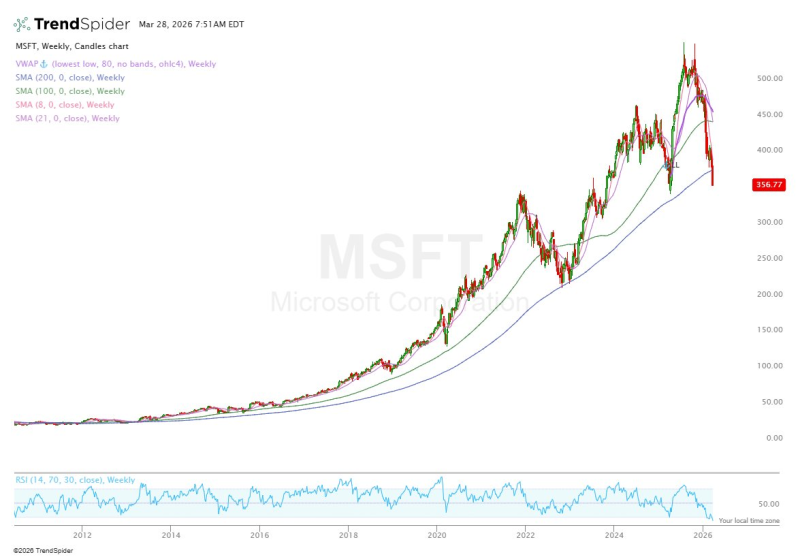
MSFT previously maintained a clean pattern of higher highs and higher lows, supported by rising long-term averages. That pattern has now weakened. The latest leg down pushed through multiple moving averages in sequence, culminating in a close beneath the 200-week line - an event not seen in more than a decade.
This level, which historically acted as a floor, now becomes a reference zone where price may face resistance if revisited.
This level, which historically acted as a floor, now becomes a reference zone where price may face resistance on any attempted recovery.
A Clear Loss of Momentum in MSFT's Weekly Structure
The breakdown is not happening in isolation. The chart shows a broader deterioration in trend behavior:
- The rally into recent highs failed to sustain continuation
- Price has since transitioned into lower highs and lower lows
- Shorter-term moving averages are sloping downward, aligning with the decline
The weekly RSI is trending lower as well, reflecting fading strength rather than any signs of immediate reversal. MSFT Stock Falls 25% as Microsoft AI Growth Signals Upside captures how the fundamental narrative has been running counter to the technical deterioration - a tension that has yet to resolve.
Pressure Builds Below Former MSFT Support as Decade-Long Level Breaks
The current price action shows MSFT trading well below the 200-week moving average, with the gap between price and that level expanding quickly. The speed of the decline indicates strong selling pressure with limited signs of stabilization so far.
MSFT Stock Holds $400 Level as Options Activity Picks Up marked an earlier attempt to defend a key psychological level - one that has since given way. Microsoft Approaches Uncommon 20% Decline as Chart Patterns Echo Previous Corrections had already flagged the structural parallels forming ahead of this breakdown.
In prior cycles, pullbacks into major moving averages led to consolidation and continuation - this time, price has not only tested but moved decisively through long-term support.
MSFT is now at a point where the technical narrative has clearly changed. Whether price stabilizes or continues to reprice lower will depend on how it reacts around this broken long-term level - but for now, a decade-long support has been decisively lost.
 Eseandre Mordi