 Alex Dudov

Microsoft is flashing a rare and technically significant signal. MSFT has not only failed to sustain a long-term breakout - it has now broken back below the very trendline that defined its multi-year advance. As MentoviaX noted, this kind of breakdown is unusual for a stock that has led the S&P 500 for years, and it places the current structure under serious pressure.
The first time in roughly a decade that a major breakout has failed and fully broken down through its supporting structure.
A MSFT Break That Hasn't Happened in 10 Years
The chart highlights a consistent long-term uptrend built on rising support lines, each respected during prior corrections. This structure has now been violated.
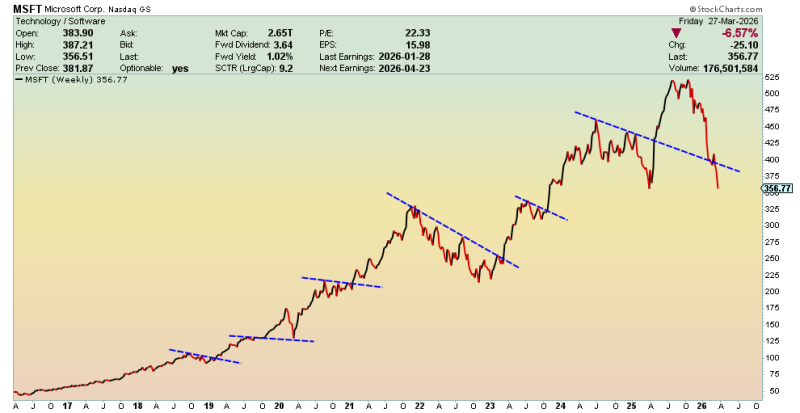
Price recently peaked above the $500 region before sharply reversing. The decline pushed MSFT decisively below the most recent breakout trendline - a key detail emphasized in the original setup. This is the first time in roughly a decade that a major breakout has failed and fully broken down through its supporting structure.
This type of move shifts the technical narrative from continuation to instability.
The Pattern Turning Ugly
The current formation reflects a clear loss of upward structure. Instead of holding higher lows, MSFT is now breaking down through support zones, forming a sharper downward leg.
The visual pattern aligns with failed breakout behavior - a setup where price returns below a previously broken trendline and accelerates lower. Similar breakdowns in MSFT have historically led to extended corrections after losing key technical levels, as covered in an earlier Microsoft Tests Key Support Zone as Stock Pulls Back to Multi-Level Confluence Area.
Price action becomes more volatile and reactive once a stock stops respecting its long-term pattern.
Recent coverage also shows Microsoft repeatedly testing lower support zones after sharp pullbacks, reinforcing the idea that momentum has weakened across higher timeframes. A notable example was when Microsoft Stock Plunged Below $480 in a Sharp Pre-Market Selloff, confirming the deterioration across multiple sessions.
MSFT Downside Path: $270-$280 in Focus
The projection outlined in the chart points toward a potential move into the $270-$280 range.
This aligns with earlier structural zones where price previously consolidated during past cycles. With the breakdown already confirmed on the chart, the path lower becomes technically viable unless the stock can reclaim the broken trendline.
Additional analysis from similar setups highlights how MSFT tends to revisit deeper support zones after losing key structural levels, especially following extended rallies - a dynamic explored in depth in Microsoft Tests $350 Support Zone With Oversold Weekly Signal.
Structure No Longer in Control
What makes this setup notable is not just the drop, but the shift in structure. MSFT is no longer respecting the long-term pattern that defined its decade-long advance.
Instead of orderly pullbacks within an uptrend, the breakdown changes how the stock behaves entirely.
The break of a major trendline changes how the stock behaves. For now, MSFT is trading in a different technical environment - one where the previous trend can no longer be assumed, and where the downside scenario outlined in the chart remains firmly in play.
 Alex Dudov


