 Peter Smith

After a strong bounce from recent lows, IREN has gained roughly 38%, aligning with the move highlighted by StockTrader_Max. The chart now shows price pushing toward the $45 area - a level that could define whether the correction phase is complete.
The IREN Pattern Behind the 38% Rebound
The chart reflects a completed corrective sequence following a strong prior uptrend. After peaking near the $70+ region, IREN moved into a three-wave decline labeled (A), (B), and (C).
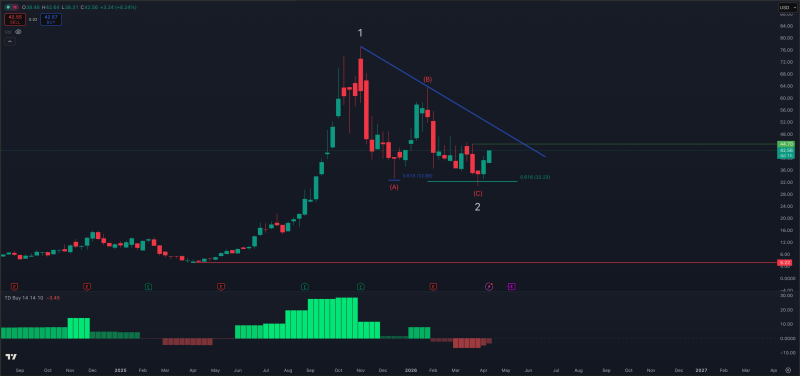
Wave (A) drove price into the low $30s, followed by a rebound forming a lower high (B). The final leg (C) returned to the same support zone near $32-$33, where price stabilized - aligning with the 0.618 Fibonacci region where selling pressure paused. Since then, the structure has shifted: price is no longer making lower lows and has instead started to recover, building upward momentum from that base.
The IREN Level That Decides the Next Structure
The $45 zone stands out as the defining level on the chart - acting as both horizontal resistance and the threshold for a structural shift. A break above this level would form a higher high, the first since the correction began. That transition is critical in technical analysis because it signals the end of a downtrend and the potential start of a new upward structure.
The chart also shows a descending trendline from the prior peak pressing down on price, creating a confluence near the current level and reinforcing $45 as the key barrier where both horizontal and trendline resistance meet.
IREN Stock Eyes $40 Breakout as Compression Pattern Tightens captured the earlier stage of this breakout attempt when $40 was the initial target, showing how IREN has been working through resistance levels in sequence as the recovery from $32 has developed.
IREN Compression Before Potential Expansion
Price is currently consolidating just below resistance, with smaller candles forming after the initial rebound. This suggests a pause rather than a reversal - the market absorbing recent gains before the next directional move:
- A strong rebound off the $32 support zone
- Price holding above prior lows without breakdown
- Repeated tests of resistance just below $45
IREN Stock Near $37.50 Max Pain as April 17 Expiry Pressure Builds provides context for the options dynamics that have been influencing IREN's price behavior during this recovery phase - showing how expiry-related pressure has been a factor in the compression below resistance.
IREN Stock Compression Builds Toward $70 and $111 Breakout Targets maps the longer-term targets that become relevant if IREN can clear $45 and confirm the structural shift - showing what the extended recovery could look like if the higher-high pattern is validated.
 Peter Smith


