 Saad Ullah

⬤ IREN shares edged higher on Nasdaq while the broader market sold off hard at the open, with the Dow shedding around 600 points. The relative strength is being widely linked to MSCI Index inclusion effects: as benchmark-tracking funds are forced to rebalance, mechanical buying creates a pocket of demand that can briefly insulate a single stock from macro-driven selling pressure.
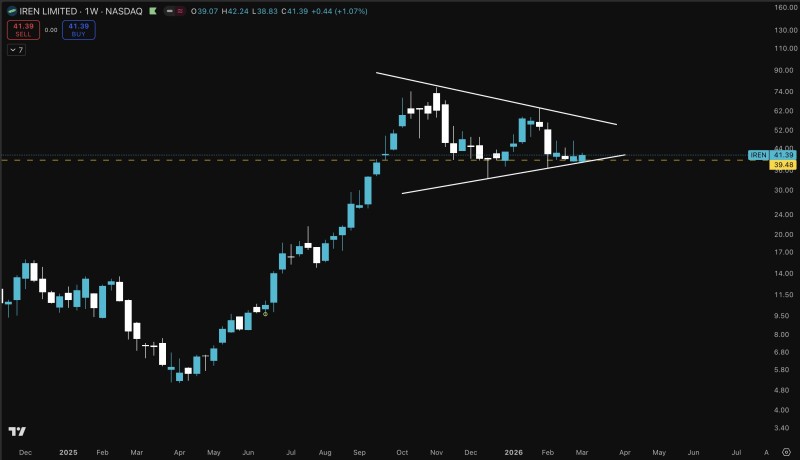
⬤ On the weekly chart, IREN was last quoted near $41.39, trading in a band between roughly $38.83 and $42.24, with $39.48 acting as the nearest support reference. Price is compressing inside a wedge-like pattern, with descending resistance from late-2024 highs pressing against rising support built during the late-2024-to-early-2025 base. That kind of tightening is a market in equilibrium, and small weekly gains read louder when the broader tape is bleeding.
⬤ The thesis here is about flow mechanics, not fundamentals. MSCI USA Index inclusion driving forced buying has been the central framing from TheTradable, which detailed how passive money acts as structural support even during fragile sentiment periods. A separate note covered IREN consolidating near $40.95 ahead of a volatile Monday open, pointing to the same wedge compression visible on the weekly chart and the risk of an outsized gap move.
⬤ What makes this relevant right now is the contrast: IREN holding its own during a risk-off open suggests that index-related positioning can temporarily outweigh macro headwinds in individual names. If price keeps defending the high-$30s to low-$40s zone as the wedge tightens further, the next big directional move could define near-term sentiment for the stock. TheTradable has also flagged IREN testing $45 resistance as traders watch for a breakout or further consolidation, which underscores just how close the chart is to a decision point.
 Saad Ullah


