 Eseandre Mordi
⬤ Iris Energy is catching fresh eyes as its weekly logarithmic chart puts recent trading into perspective. When you zoom out from the daily noise, IREN's bigger picture becomes clear—the stock has climbed significantly from its 2022 bottom and is now trading within an upward structure that's been forming for over a year.
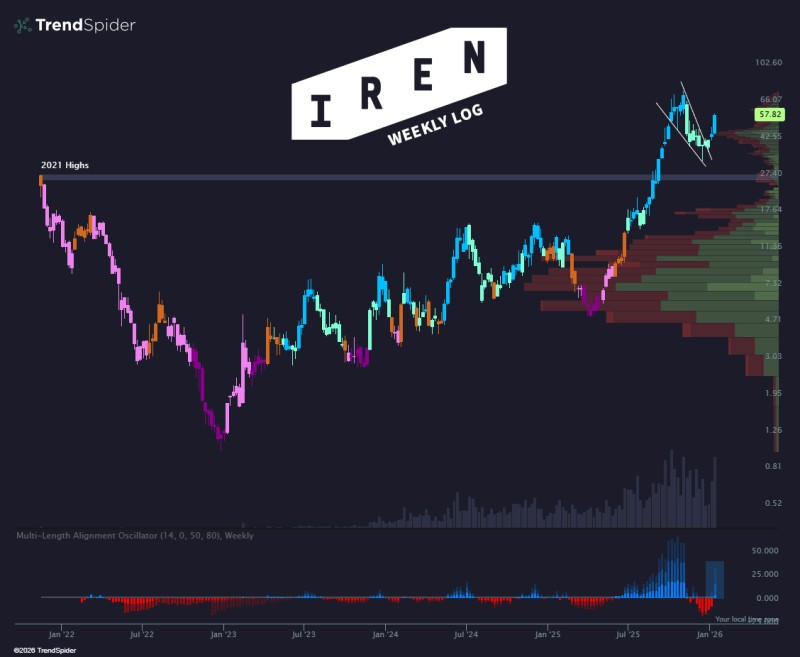
⬤ The weekly view shows IREN's fall from 2021 peaks, followed by a long bottoming process throughout 2022 and into early 2023. From there, the stock started building higher lows and gathering momentum heading into 2024. What looks choppy on shorter timeframes reveals itself as a steady recovery when you step back to the weekly chart.
⬤ IREN recently pushed into the mid-60s before cooling off into consolidation mode. Right now it's trading in the high-50s within a short-term downward channel. Volume spiked during the earlier rally, and the chart's volume profile shows where heavy trading happened historically—clusters that often mark support zones and areas where price tends to react.
⬤ Why the weekly chart matters: higher timeframes cut through the daily chop and show you the real trend. By placing current consolidation inside IREN's broader recovery structure, this perspective helps traders understand whether recent pullbacks are just pauses in a larger move or something more significant. That context shapes how the market reads momentum, volatility, and what might come next.
 Eseandre Mordi


