 Saad Ullah

⬤ IREN Limited is catching traders' eyes again as the stock pushes toward the upper $50s after bouncing back from its early 2025 lows. The current chart setup looks strikingly similar to a pattern that played out before—one that led to a sharp rally. Daily price action combined with institutional ownership data paints an interesting picture of how the technical landscape and big-money positioning have shifted over time.
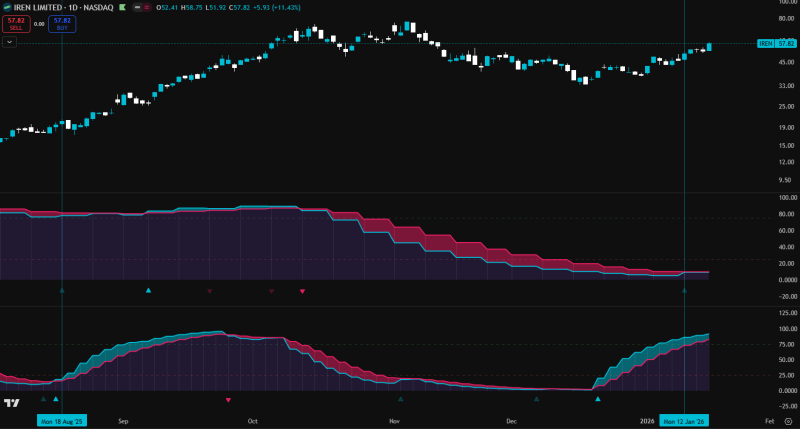
⬤ On the daily chart, IREN's climbing toward the high-$50 zone after pulling back earlier this quarter. The price has been making higher lows while squeezing into tighter ranges—forming what looks like triangular consolidation. This isn't the first time this pattern showed up. Previously, when a similar structure appeared around the $20 level, the stock rocketed toward $70. Right now momentum's improving, though price is still trading within a defined range rather than breaking out into new territory.
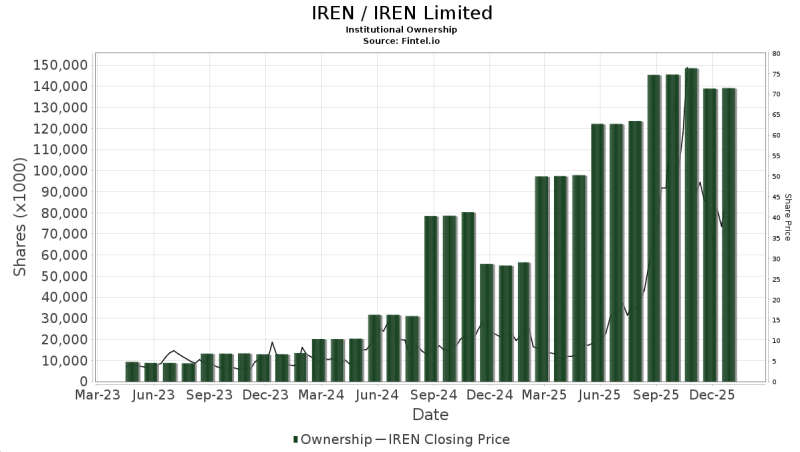
⬤ The long-term institutional ownership picture adds useful context. Fintel.io data shows institutions holding over 140 million shares throughout most of 2025. Even as the stock price bounced around, those ownership levels stayed relatively stable—suggesting big players haven't been heading for the exits. The overlay of price movement and ownership trends shows institutional positioning held firm even during volatile stretches.
⬤ What makes this interesting is how the technical pattern and ownership data line up. When institutions stick around with significant positions, it often means better liquidity and can influence how price behaves during consolidation phases. For IREN, this combination of a familiar chart pattern repeating itself plus steady institutional backing keeps the stock on traders' radar as they watch whether this setup leads to another sustained move or just more sideways action.
 Saad Ullah


