Saad Ullah

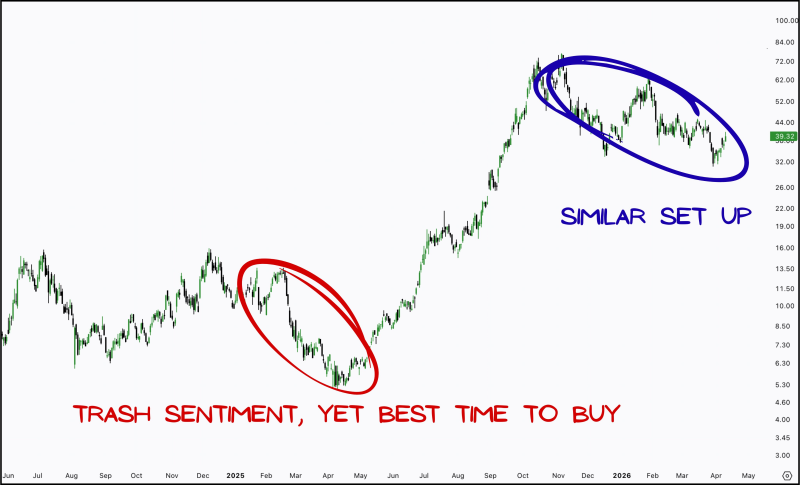
IREN has returned to a familiar point in its cycle, where investor sentiment is deteriorating just as price action begins to stabilize. The chart highlights a recurring pattern: a sharp correction followed by a period of emotional exhaustion, similar to the phase that preceded last year's major rally.
A Correction That Feels Uncomfortably Familiar
The chart structure reflects a multi-month decline following a strong prior advance, transitioning into a choppy consolidation phase rather than continued downside acceleration. This mirrors the earlier period marked on the chart, where price weakened before forming a base.
As 𝐀𝐠𝐫𝐢𝐩𝐩𝐚 𝐈𝐧𝐯𝐞𝐬𝐭𝐦𝐞𝐧𝐭𝐬 noted, the current environment is strikingly similar to last year's April selloff, when sentiment collapsed and frustration dominated investor discussions. The same pattern of disbelief and negativity now appears to be repeating - even as price behavior begins to stabilize.
When IREN Sentiment and Structure Diverge
The key shift visible on the chart is the transition from impulsive downside into a more balanced structure. Price is no longer trending aggressively lower but instead moving sideways - suggesting that selling pressure is losing momentum even as the narrative remains overwhelmingly negative.
This phase often coincides with extreme pessimism, where market participants focus on recent losses while overlooking structural stabilization. IREN stock tests $32-$40 support as breakout setup builds shows how the support dynamics in this exact price zone have been forming over multiple tests - reinforcing that the stabilization visible on the chart has a structural foundation rather than being a temporary pause in the decline.
The IREN Pattern That Tends to Repeat
The comparison between the two phases on the chart highlights a recurring cycle in price behavior and sentiment. The sequence is consistent across both instances:
- A strong rally followed by a multi-month corrective decline
- Sentiment reaching extreme negativity during consolidation
- Price stabilizing rather than continuing to break down
IREN stock builds base near $30, eyes breakout above $40 captured the base-building dynamic at a lower level, showing how IREN has been constructing structure across multiple support zones during this corrective phase. IREN stock eyes $40 breakout as compression pattern tightens adds the compression dimension, reinforcing that the current sideways structure is not aimless consolidation but a tightening pattern that has preceded expansion in prior setups.
 Saad Ullah