Saad Ullah

HIMS & Hers Health (HIMS) is trading around $19.43, sitting just 57 cents below the $20 max pain level into this week's expiration. Fibby. flagged the setup as one where positioning - not just price action - becomes the dominant force as expiration approaches.
The options structure is strikingly uneven. Call exposure builds steadily above current price, while meaningful put interest is concentrated far below, leaving a wide gap with little downside support anywhere near $19.
The $20 Max Pain Level Pinning HIMS Stock
The chart places max pain at $20, with HIMS stock trading just beneath it. That proximity alone tells a story - the stock appears anchored near expiration, pulled toward the strike where the most options value would expire worthless.
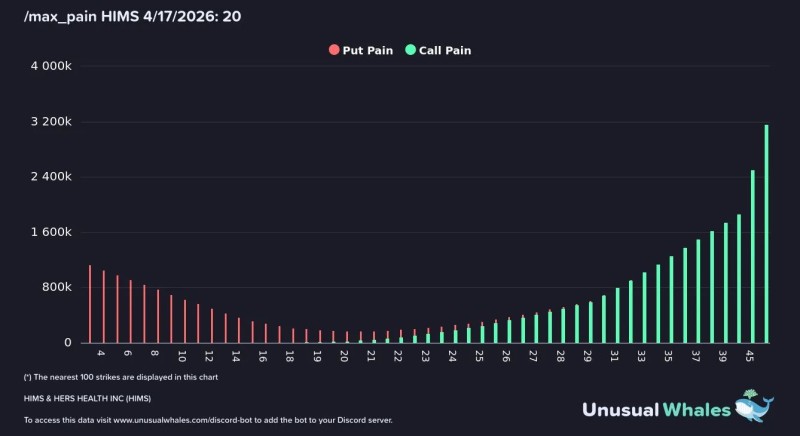
What makes this HIMS setup particularly notable is the absence of put support close to current price. Gold Tests Key Resistance at $4,750-$4,800 as Breakout Decision Looms shows a comparable dynamic in commodities, where structure around key levels defines near-term price behavior. For HIMS, puts are stacked heavily below $8, creating a roughly $11 gap between that floor and current price where options structure offers virtually no downside defense.
HIMS Call Wall Runs From $23 to $45 Strike
Above spot, the structure shifts dramatically. Call positioning begins building around $23 and extends in a broad, continuous ladder all the way to $45 - this is not a single-strike anomaly but a sustained wall across multiple levels:
- Call positioning increases steadily from $23 upward
- Every strike from $31 to $45 exceeds 1M in size
- The $45 strike alone reaches approximately 3.2M
That concentration forms one of the more defined call walls visible in current single-stock positioning, spanning over 20 strike points above current price.
HIMS Stock and the $23 Threshold That Changes Everything
The $23 level is where the setup materially changes. Below it, HIMS price remains largely disconnected from the bulk of call exposure. Above it, price would begin interacting with progressively larger open interest at every strike. Gold Holds Near $4,080 as Triangle Pattern Tightens and Gold Hovers Near $4,300 as Two Scenarios Emerge offer additional context on how resistance concentration tends to cap upside movement until a decisive break occurs.
The chart does not signal directional certainty for HIMS stock - but it does define the imbalance clearly. Heavy call exposure sits overhead, put structure is absent near current levels, and price is holding close to max pain with expiration just days away.
A large concentration of calls overhead combined with limited nearby put support defines the current positioning into expiration.
That combination keeps HIMS effectively pinned, with the $23 level marking the threshold where the options landscape changes significantly.
 Saad Ullah