 Marina Lyubimova

HIMS sits at a technical crossroads as extreme negative sentiment meets defined support levels. The stock has carved out a potential bottoming pattern, but traders are watching one key level to confirm whether the downtrend is truly over or if more pain lies ahead.
Blood in the Streets: Sentiment Hits Rock Bottom
Technical analysts have mapped a trend reversal zone between the 0.786 retracement at $17.76 and the 0.886 retracement at $10.73. This yellow box on the chart marks where stabilization typically happens. The stock's multi-leg corrective move has pushed price directly into this band, and the question now is whether it holds.
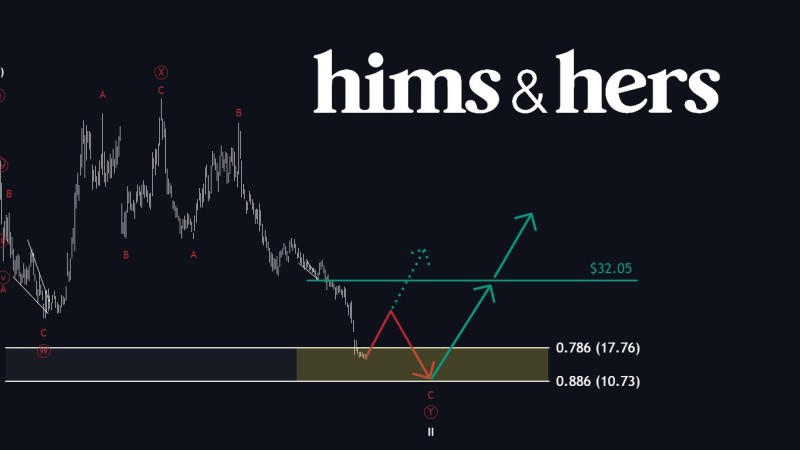
The projected path suggests two scenarios: either HIMS rallies from current levels, or it takes one final dip before rotating higher. While the low might already be in, the technical model favors a brief pullback before any sustained upside begins. Previous analysis showed the stock testing support levels throughout its decline, including when HIMS Stock Tests Critical 2021 Support Level.
$32.05: The Make-or-Break Level
Everything hinges on $32.05. That horizontal resistance line isn't arbitrary - it's the pivot point that would confirm a completed bottom. A sustained break above this level would signal the corrective phase is done and a new uptrend structure is emerging.
Until HIMS reclaims $32.05, the trend stays in limbo. The stock remains vulnerable to further downside if it can't hold within the defined retracement box. Earlier technical patterns showed some resilience when HIMS Stock Holds $27 Support Level, but that support eventually gave way.
The setup captures the classic battle between technical structure and market psychology. Negative sentiment is maxed out, support levels are clearly defined, and the reversal threshold is known. If HIMS breaks $32.05 after bouncing from the reversal zone, it could flip the entire trend. Fail to reclaim that resistance, and the corrective phase drags on.
 Marina Lyubimova


