 Saad Ullah
⬤ Telehealth platform HIMS is catching traders' attention as it approaches a critical technical milestone. The slow Stochastic indicator is creeping toward a crossover—a signal that's historically preceded significant price jumps. This isn't just theory: the stock has already delivered a massive 92% gain and a solid 27% surge following similar setups. Now, the big question is whether history's about to repeat itself.
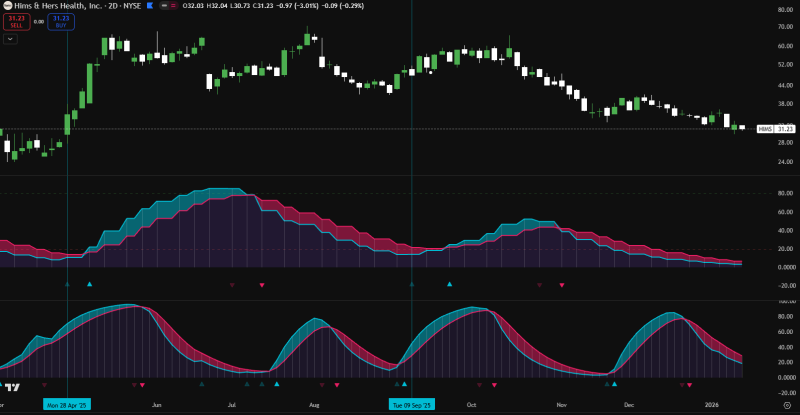
⬤ The chart reveals something interesting: two bullish triangle formations that typically signal brewing momentum. These patterns aren't random—they've consistently appeared before HIMS made strong upward moves. With the slow Stochastic now hovering near crossover territory, the stock looks poised for another potential breakout as buying pressure builds.
⬤ Looking at past performance, there's a clear pattern. The 92% and 27% rallies both emerged from nearly identical technical setups. If HIMS follows the same playbook, another substantial move could be on the horizon. The market's picking up on these signals, with growing anticipation that the stock might deliver another impressive run.
⬤ The technical picture is becoming increasingly compelling. Between the bullish triangles and the approaching Stochastic crossover, HIMS appears to be setting up for its next growth phase. Whether it can maintain this momentum and replicate past gains remains to be seen, but the ingredients for another rally are definitely there.
 Saad Ullah


