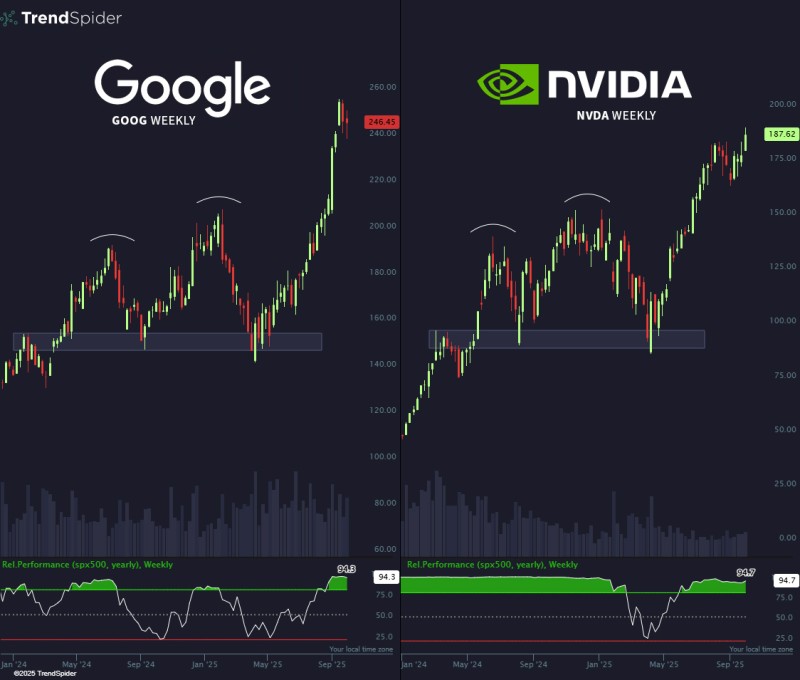
Big tech stocks are proving the doubters wrong. Both Google and Nvidia were showing head-and-shoulders formations on their weekly charts - a pattern many traders watch as a potential reversal signal. But instead of breaking down, these stocks did the opposite: they surged, catching bears off guard and sparking fresh bullish momentum.
Google Stock Analysis (GOOG)
Google's weekly chart appeared to be forming a head-and-shoulders top with the neckline sitting around $160–$165. Most traders would expect this setup to trigger a move lower. What happened instead? The stock blew past resistance and climbed all the way to $246.45.
TrendSpider trader analysis showed this invalidation forced short sellers to scramble for cover.

Google's relative strength versus the S&P 500 now stands at 94.3, confirming its position as a market leader. The pattern that was supposed to signal weakness ended up fueling strength.
Nvidia Stock Analysis
Nvidia showed a nearly identical setup. A head-and-shoulders pattern looked like it might send shares down toward the $100 zone, but buyers stepped in fast. The stock now trades at $187.62, displaying renewed momentum and resilience.
Its relative performance against the S&P 500 is at 94.7- slightly ahead of Google - which highlights Nvidia's dominant role in the AI and semiconductor rally.
Why Bears Were Wrong
The failure of these bearish formations is a textbook example of bear traps. Instead of collapsing, both stocks rallied hard on the back of strong earnings and growing demand for AI technology.
Key drivers include:
- Earnings beats from both companies
- Sustained demand for AI infrastructure powering Nvidia's growth
- Institutional capital rotating into big tech as both a defensive and growth play
Key Takeaways
The invalidation of bearish patterns in Google and Nvidia shows just how powerful bullish momentum can be when fundamentals align. Even classic technical setups can fail spectacularly when sentiment and earnings are pointing the other way. For investors, these two tech giants remain critical indicators of strength in the broader equity rally.
 Saad Ullah

 Saad Ullah


