 Saad Ullah
Nvidia (NVDA) remains in the spotlight following an exceptional year fueled by AI-driven growth. The stock recently broke through major resistance and is now testing that level as support. Traders are watching closely to see if NVDA can hold this critical zone before making another leg higher.
NVDA Retests Support
The daily chart from TrendSpider shows Nvidia consolidating just above $184.50–$185.00, a price area that previously acted as resistance.
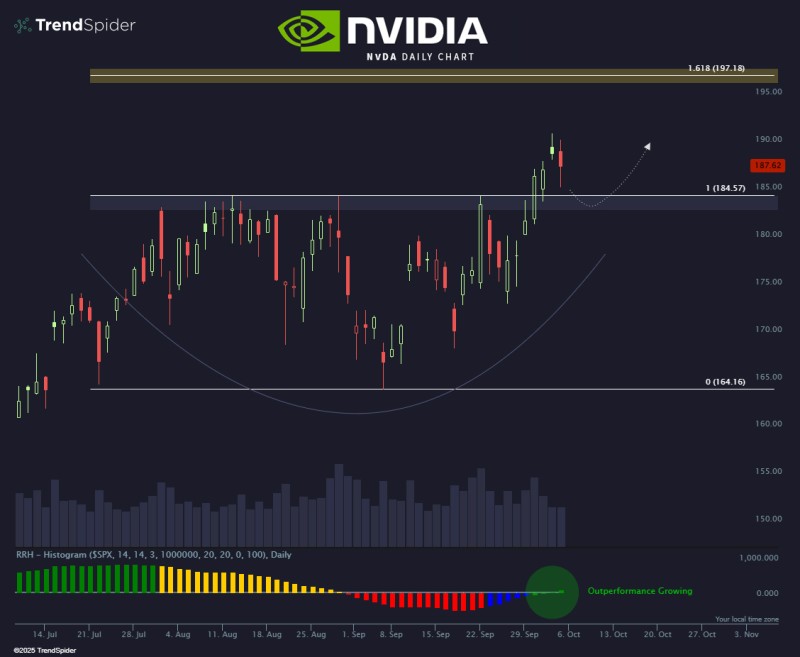
This kind of retest is common in strong uptrends and often sets the stage for the next push higher.
Technical Chart Analysis
The $185 level has become the line in the sand for bulls. Holding here keeps the uptrend intact and opens the door for a move toward $197.18, based on the Fibonacci 1.618 extension. The stock's rounded base pattern since August suggests continuation rather than reversal, which typically precedes sustained rallies. Meanwhile, momentum indicators show NVDA outperforming the S&P 500, with that relative strength expanding. The support zone is $185, the upside target sits at $197.18, the rounded base signals a continuation pattern, and momentum confirmation shows growing outperformance versus the broader market.
Why Nvidia Stays in Focus
Nvidia continues to dominate as the leading GPU supplier powering AI infrastructure globally. Demand from cloud providers and enterprises shows no signs of slowing, with chip orders accelerating. Recent earnings reports have reinforced confidence in the company's growth trajectory, and as a bellwether for the tech sector, NVDA's performance reflects broader investor sentiment toward AI and growth stocks.
 Saad Ullah


